The previous Celestion driver I examined in Test Bench (Voice Coil, November 2013) was the CF18VJD, another 18” high-powered pro sound woofer. So this month I am going to characterize the CF180JD, a new 18” Celestion pro sound subwoofer.
As I commented in the CF18VJD article, my being a professional musician at one point in this life made me a lifetime Celestion fan. In fact, I still own a Vox AC30 guitar amplifier that incorporates a pair of the legendary 12” Celestion Blues, plus a Marshall Mini-Stack with a pair of 10” Celestion Greenbacks! If you are not familiar with Celestion’s history (it’s a rather interesting story), you might want to check out the introduction that I wrote for the Celestion AN3510 test bench review (Voice Coil, September 2013).
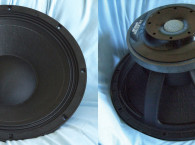
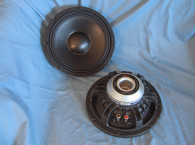
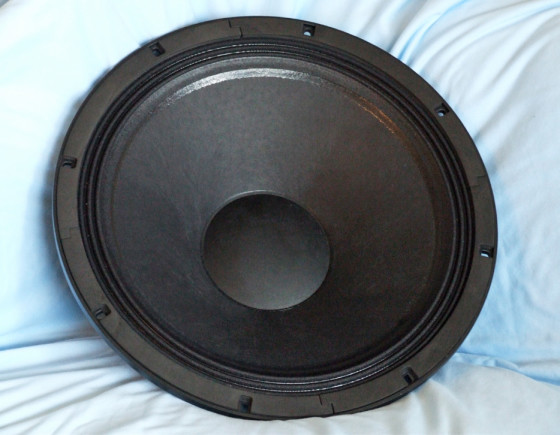
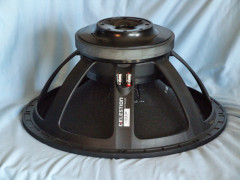
Designated as a woofer/subwoofer, the CF1840JD is a fairly high power handling woofer rated at 1,000 WRMS (AES standard) and weighs a moderate 25.5 lb. The CF1840JD’s features include a proprietary seven-spoke cast-aluminum frame. However, Celestion’s approach on this model, as with the CF18VJD, does not include venting below the spider mounting shelf at the top of the front plate, which is a common feature built in to high power handling woofer frames. Instead, Celestion uses a series of eight 9-mm diameter peripheral vents located on the top of the back plate in conjunction with a 40-mm diameter pole vent.
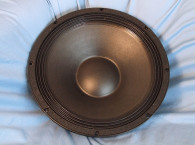
The cone assembly consists of an 18” Kevlar-loaded paper cone and a large 5.5” diameter paper dust cap. Suspension is provided by a three-roll M-shaped coated (sealed) cloth surround in conjunction with two 7” diameter flat-treated cloth spiders (dampers), which I would assume are mounted back-to-back to cancel out odd-order nonlinearity. All this is driven by a 4” (100-mm) diameter high-temperature nonconducting glass fiber voice coil former wound with a two-layer inside/outside round copper wire winding. The voice coil is terminated to a pair of color-coded chrome push terminals.
Celestion’s CF1840JD has a substantial ferrite finite element analysis (FEA) optimized motor assembly. This consists of a single 217 mm × 22 mm ferrite magnet sandwiched between a black-coated 200-mm diameter front plate that forms the 10-mm gap area and a 200-mm diameter × 25-mm high milled shaped T-yoke, also black coated. Also included in the motor structure are a set of dual shorting rings (Faraday shields) to reduce flux modulation and hence, distortion.
To begin the CF1840JD testing, I used the LinearX LMS and the VIBox to produce voltage and admittance (current) curves with the driver clamped to a rigid test fixture in free air at 1, 3, 6, 10, 15, 20, 30 and 40 V. Please note, I use a procedure that attempts to achieve the third time constant on each sweep, such that the LMS oscillator is turned on for a progressively increasing time period between sweeps. Also following the established Test Bench test protocol, I no longer use a single added mass measurement. Instead, I used the actual measured cone assembly weight provided by Celestion, at my request.
Next, I post processed the 16 550-point stepped sine wave sweeps for each sample and divided the voltage curves by the current curves to derive impedance curves. Once phase calculated (the LMS is a single channel analyzer and does not measure phase, but it does have a highly accurate proprietary phase calculation methodology), I imported the information, along with the accompanying voltage curves, to the LEAP 5 Enclosure Shop software. Obviously, this is a much more time consuming process than the usual low-voltage small-signal impedance curve technique used to derive Thiele-Small (T-S) parameters. The reason is that the LEAP 5 LTD transducer model methodology results in a more accurate prediction of excursion at high-voltage levels, one of LEAP 5 software’s real fortes.
Because most T-S data provided by OEM manufacturers is produced using either a standard modeling method or the older LEAP 4 TSL model, I used the 1-V free-air curves to additionally create a LEAP 4 TSL model. I selected the complete data set, the LTD model’s multiple voltage impedance curves, and the TSL model’s 1-V impedance curves in the LEAP 5 Transducer Derivation menu and created the parameters for the computer enclosure simulations.
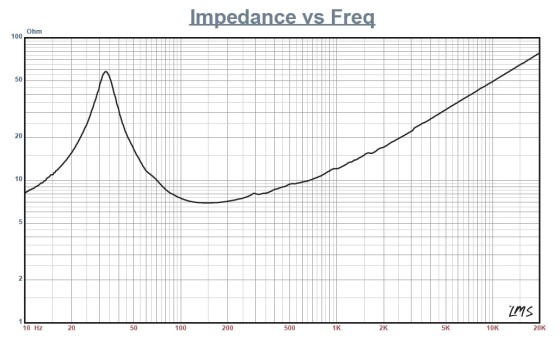
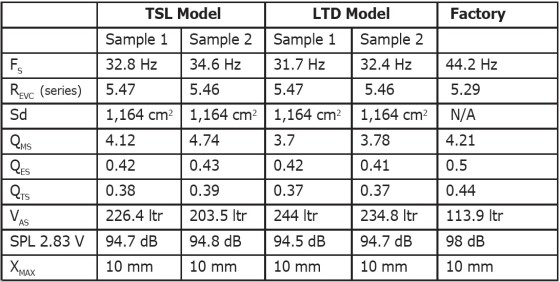
Figure 1 shows the CF1840JD’s 1-V free-air impedance curve. Table 1 compares the LEAP 5 LTD, the TSL data, and Celestion’s factory parameters for both CF1840JD samples. Beginning this issue, I will provide the Sd in cm2 rather than m2.
Because there were some discrepancies between my results and the Celestion factory FS, VAS, and sensitivity data, I programmed the factory data into the LEAP 5 transducer library. I discovered that the factory parameters did not correlate (LEAP cross correlates the various parameters). Programming the factory parameters into LEAP verified the problem. Misprints in the preliminary datasheets are not uncommon. I suspect the FS was 34.1 Hz, as changing that value caused the rest of the parameters to fall in line with mine and produced a near-identical box simulation.
However, the difference in sensitivity was not due to a misprint. My numbers are derived from a parameter calculation at 2.83 V and the Celestion factory sensitivity is a physical measurement at 1 W/1 m half space in an anechoic chamber.
I used the LEAP LTD parameters to set up two computer enclosure simulations for Sample 1. This included two vented alignments — a 4.7 ft3 QB3 box alignment with 15% fiberglass fill material and tuned to 33.8 Hz with a 6” diameter vent tube, and an Extended Bass Shelf (EBS) alignment in a 6.4 ft3 vented enclosure with 15% fiberglass fill material and tuned to 31.7 Hz.
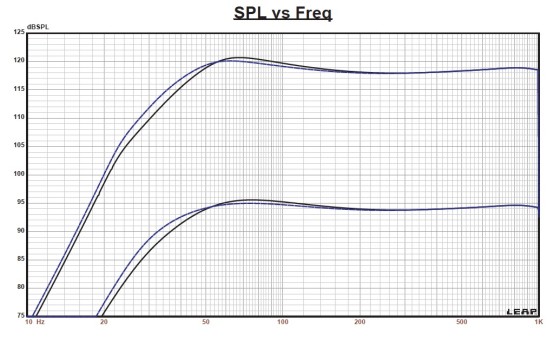
Figure 2 shows the CF1840JD’s enclosure simulation results in the QB3 and EBS vented boxes at 2.83 V, and at a voltage level sufficiently high enough to increase cone excursion to 11.5 mm (XMAX + 15%). It produced a –3 dB frequency of 43.8 Hz (–6 dB = 35.5 Hz) for the 4.7 ft3 QB3 enclosure and F3 = 37.3 Hz (F6 = 30.5 Hz) for the 6.4 ft3 EBS vented simulation. Increasing the voltage input to the simulations until the maximum linear cone excursion was reached resulted in 121 dB at 55 V for the QB3 enclosure simulation and 120 dB at the same 55-V input level for the larger vented box.
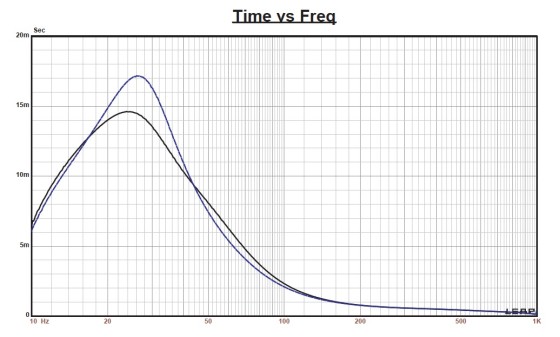
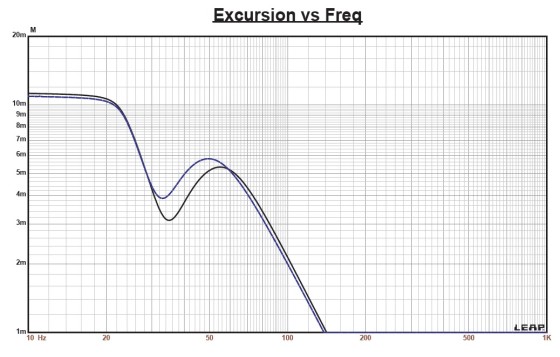
Figure 3 and Figure 4 show the 2.83-V group delay curves and the 55-V excursion curves, respectively. The voltage input was limited to 55 V as the XMAX + 15% number was exceeded at about 20 Hz. With a 25-Hz high pass, this woofer could easily have been driven several decibels louder for the same criteria.
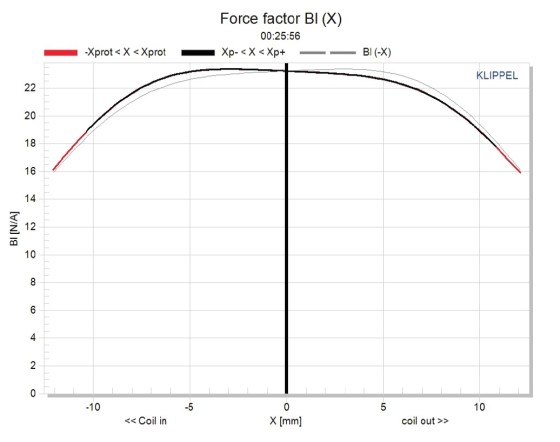
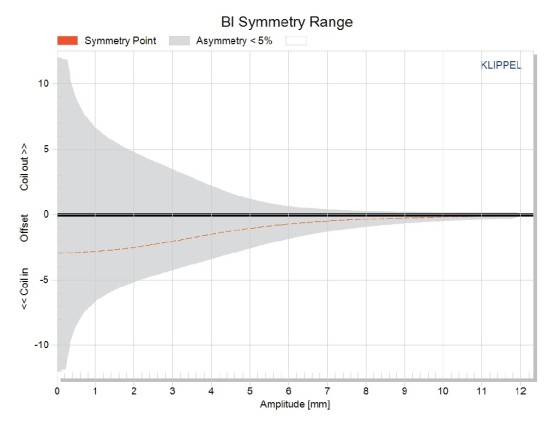
The CF1840JD’s Klippel analysis produced the Bl(X), KMS(X), and Bl and KMS symmetry range plots shown in Figures 5-8. Our analyzer is provided courtesy of Klippel GmbH. The testing is performed by Patrick Turnmire of Redrock Acoustics.
The CF1840JD’s Bl(X) curve is nicely broad and symmetrical (see Figure 5). The Bl symmetry plot in Figure 6 shows less than 1-mm coil-in offset at 5-mm excursion (where the grey uncertainty curve starts to diminish) and remains nearly constant out to the driver’s physical XMAX, which is quite good.
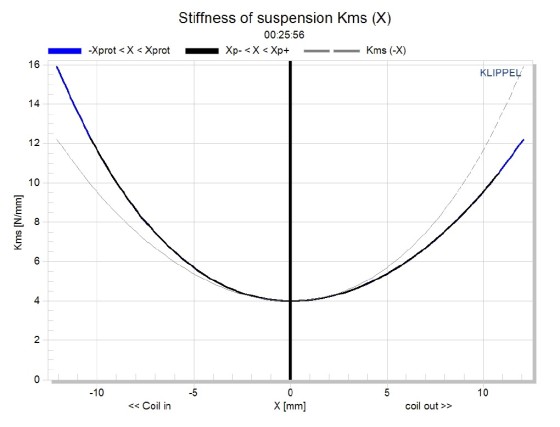

Figure 7 and Figure 8 depict the CF1840JD’s KMS(X) and KMS symmetry range curves. The KMS(X) curve is as also rather symmetrical but with some forward coilout offset beginning at 6 mm and greater excursion. Looking at the KMS symmetry range curve, the forward offset is only 0.75 mm at the driver’s physical XMAX, which is negligible.
The CF1840JD’s displacement limiting numbers, calculated by the Klippel analyzer, were XBl at 70% (Bl decreasing to 70% of its maximum value) was greater than 10.4 mm and the crossover at 50% (compliance decreasing to 50% of its maximum value) was 7.5 mm (just beyond the physical XMAX). This means that the CF1840JD’s compliance is the most limiting factor for the prescribed distortion level of 20% (the criteria for subwoofers).
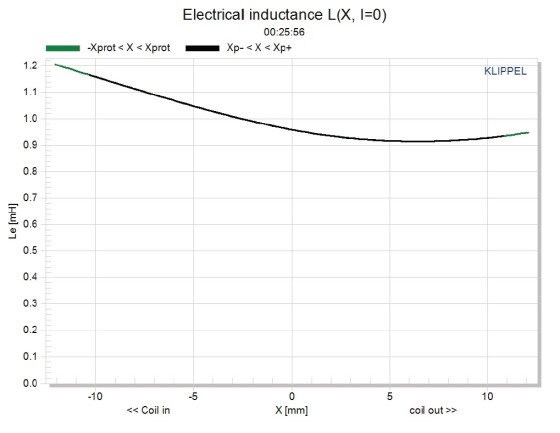
Figure 9 shows the CF1840JD’s inductance curve L(X). Inductance will typically increase in the rear direction from the zero rest position as the voice coil covers more pole area unless the driver incorporates a shorting ring. The CF1840JD has a dual shorting ring configuration and minimizes the inductive swing as the driver moves from full rear to full forward excursion. In the coil-in direction, the change is about 0.2 mH and only 0.005 mH in the forward direction.
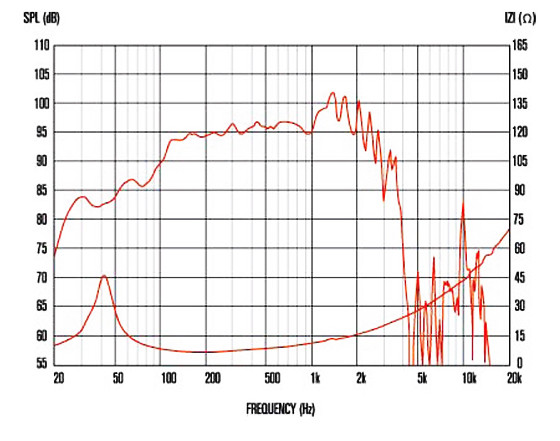
I did not conduct sound pressure level (SPL) or time-frequency measurements because I don’t keep 18” or 21” size cabinets in my inventory of test boxes. However, Figure 10 shows the factory SPL curve.
Then, I used the Listen AmpConnect analyzer, the SC-1 microphone, and the SoundCheck 12 software (all courtesy of Listen) to perform the distortion test. For the distortion measurement, I used a noise stimulus (SoundCheck has a software generator and SPL meter as two of its utilities) to rigidly mount the woofer in free air. Then, I set the SPL to 104 dB at 1 m to establish the required voltage (8.2 V for the CF1840JD). I measured the distortion with the Listen microphone placed 10 cm from the dust cap. Figure 11 shows the CF1840JD’s distortion curves.
As with the CF18VJD, Celestion’s CF1840JD is a well-designed 18” pro sound subwoofer with a nicely designated feature set for PA applications.
www.celestion.com

This article was originally published in Voice Coil, December 2014.