The Heritage Series G12H(55)
Over the years, I have characterized very few guitar-type transducers in Voice Coil’s Test Bench Column — to be exact, only three. And, these were all Eminence drivers. I featured the Red Fang Alnico guitar speaker and the BP102 bass guitar/PA speaker in Voice Coil’s May 2004 issue and the Eminence variable “Q” Maverick guitar speaker in the January 2011 issue. So, I approached Celestion about one of its Heritage Series classic guitar speakers, the G12H(55) “Greenback.”
Not so much from the standpoint of let’s analyze this speaker and see how good it is, but because it is an insanely popular classic driver that has defined high-powered rock guitar music since the 1960s. I wanted to know exactly what all the objective data looks like.
If it turns out it doesn’t look that good then maybe we need to rethink some of the criteria. However, if it looks great, we stand vindicated in our objective quest to characterize a transducer.
from the 1960s.
To provide a brief bit of history on these models, let’s start with the Celestion G12M. The G12M in a 16-Ω version was most-commonly labeled as a T1221-coded speaker and rated at 20 W. This was the speaker used in the majority of Marshall guitar cabinets from circa 1966 and onward, whether they were in the 1 × 12” mini-Bluesbreaker 18-W combo amp, in the 2 × 12“ “Bluesbreaker” combo, or in the Marshall 4 × 12” stack lead guitar cabinets. By approximately late 1968, the G12M shifted from 20 to 25 W in power handling capability and has stayed this way.
The heavy-duty speaker option at the time was the G12H, and with its larger and heavier magnet (50 oz vs. 35 oz) and stiffer cone, which had a power handling rating of 30 W. The G12H not only handled more power, but it was also a much more efficient speaker. Using the same cabinet equipped with either a G12M or a G12H, one will instantly recognize the G12H as being quite a bit louder. While the G12Ms had a 96-dB sensitivity rating, the G12H was rated at a full 100-dB sensitivity.
Jimi Hendrix is probably the most famous G12H user. However, legend has it that he blew up one too many G12Ms and before making the switch. And contrary to popular belief, the “H” in G12H stands for heavy magnet, not Hendrix.
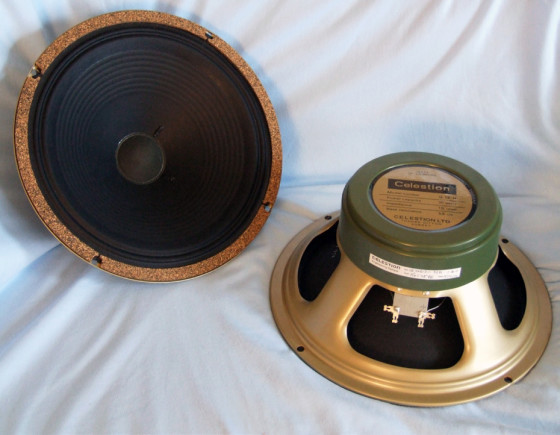
The new Heritage Series G12M and G12H “Greenbacks” (named for the green plastic magnet covers) were designed to be faithful reissues of the originals from the 1960s. According to Celestion, they were precisely manufactured to the design notes and specifications of the original 1960s speakers and use the exact same materials and construction techniques.
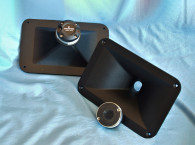
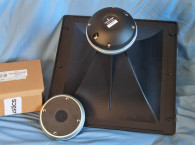
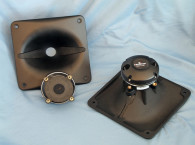
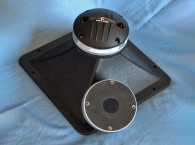
Indeed, cosmetically, the speaker details are true to the original — not only with the greenback magnet cover and appropriate labeling on the sticker, but also the cone, dust cap, and even the cork gasket material surrounding the speaker cone are just like the originals.
In terms of features, the 16-Ω G12H(55), which is the lower 55-Hz resonance version of the G12H (the resonance of the “regular” G12H is 79 Hz), is built on an “old school” four-spoke stamped fame sprayed with gold-colored paint. The cone is a single piece cone/surround made from ribbed paper with a twin rolled edge and a stiff breathable cloth 2.25” diameter dust cap, which includes the cork mounting gasket.
Remaining compliance comes from a 4.5” elevated cloth spider. Powering this transducer is a 168-mm diameter ceramic magnet sandwiched between 8-mm thick front and back plates covered with the signature green plastic cover. The G12H has a 1.75” (44.5 mm) diameter voice coil made from an aluminum former wound with round copper wire, and tinsel leads terminated to a solderable set of terminals.


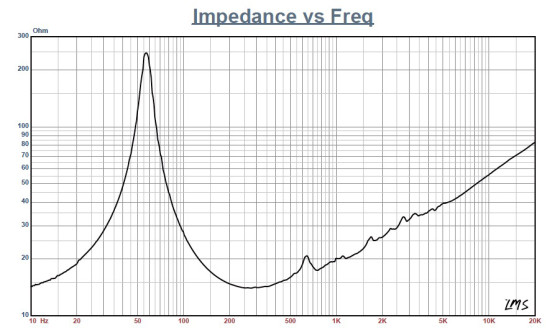
To set up for the initial parameter testing, I clamped the driver to a rigid test fixture in free air, and generated both voltage and admittance (current) curves at 0.3, 1, 3, 6, 10, 15, and 20 V. I ended up discarding the 20-V curves as they became too nonlinear for LEAP 5 to get a close curve fit. I post-processed the remaining 12 10-Hz-to-20-kHz 550-point stepped sine wave voltage and current curve pairs for each driver and divided the voltage curves by the current curves to create seven impedance curves. I applied the LMS phase calculation procedure to the impedance curves and imported them, along with the voltage curve for each sweep, to the LEAP 5 Enclosure Shop CAD program.
I used the 1-V free-air curves to additionally create a LEAP 4 TSL model. Next, I selected the complete curve set, the LTD model’s multiple voltage impedance curves, and the TSL model’s 1-V impedance curves in the transducer derivation menu in LEAP 5 and created the parameters (using the fixed Mmd method, with the cone assembly weight supplied by Celestion) for the computer box simulations. Figure 1 shows the 1-V free-air impedance curve.
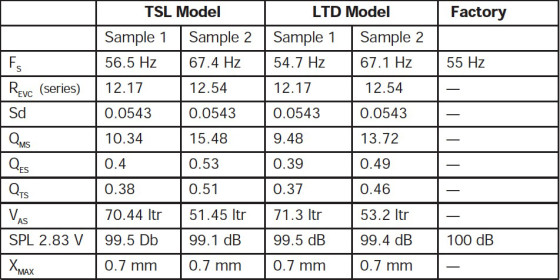
Table 1 compares the LEAP 5 LTD and TSL data and factory parameters for both G12H samples. Please note that Celestion, like most guitar speaker manufacturers (e.g., Eminence, Weber, and others) do not publish full T-S parameter on their guitar speaker products.
The G12H’s T-S parameter results were certainly close to two factory specifications—the Fs/Qt ratios are close. However, there was some obvious variance between my two samples, but both drivers produced nearly the same results in a computer simulation, so we are just looking at normal production variations.
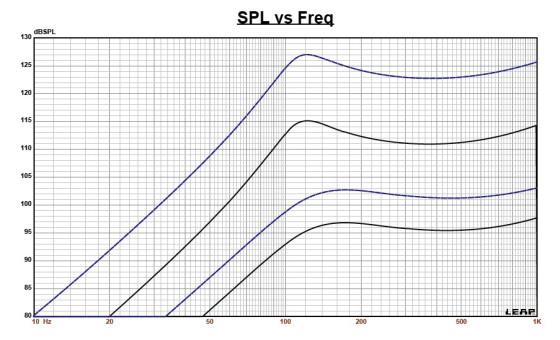
Next, I programmed computer enclosure simulations with the LEAP LTD parameters for Sample 1 using the per driver volume from a Marshall MX212 cabinet, which is a 2.29 ft3 sealed box design with no box damping material. For the second simulation rather than using a different cabinet volume, I did a simulation with four G12H transducers in a single sealed cabinet the size of a Marshall half stack.
Figure 2 shows the results for a single G12H(55) in a 1.15-ft3 sealed box and for four G12Hs in a 4.6-ft3 sealed enclosure at both 2.83 V and at a voltage level sufficient to increase the excursion to 2.19 mm (XMAX + 15%). This calculation resulted in a F3 frequency of 106 Hz (F6 = 87 Hz) for both simulations.
Increasing the voltage to 32 V for the single G12H simulation and 64 V with the four G12H driver simulation resulted in 115 dB for the single driver and 122.6 dB for the Marshall half-stack four driver simulation. Figure 3 shows the 2.83-V group delay curves. Figure 4 shows the 32-V/64-V excursion curves.

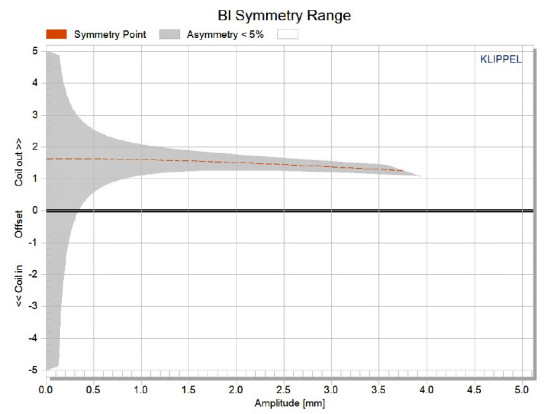
The G12H’s Klippel analysis produced the Bl(X), KMS(X), and Bl and KMS symmetry range plots shown in Figures 5–8. Figure 5 shows the G12H’s Bl(X) curve is fairly narrow, as would be expected for a very short XMAX driver. It is also moderately symmetrical with a fair amount of coil-out offset (compared to the very short XMAX). Figure 6 shows the Bl symmetry plot. The forward coil-out offset is 1.6 mm from rest to the physical XMAX, and tapers off somewhat as excursion increases. This is consistent with guitar speaker technology and suggests a deliberate forward offset, which is done to increase the amount of second order harmonic distortion, something that sounds really good with electric guitar.
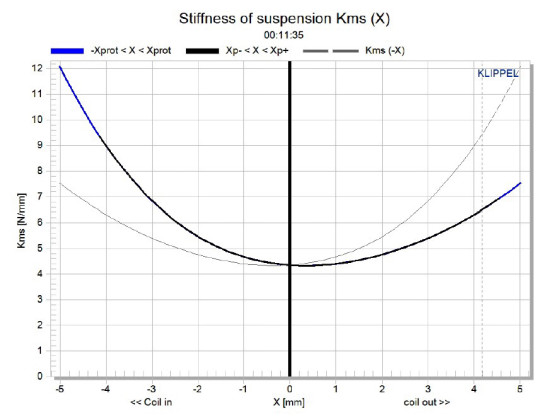
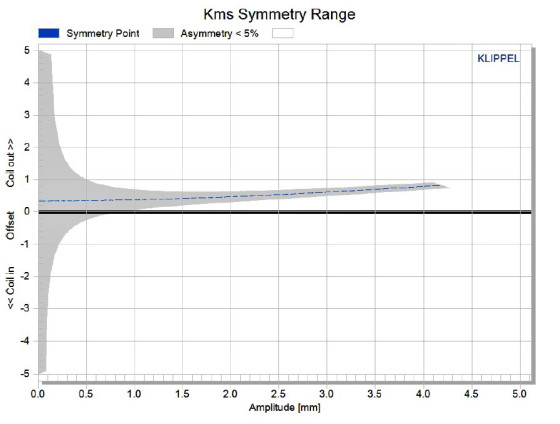
Figure 7 shows the G12H’s KMS(X) symmetry range curve, which is somewhat asymmetrical, typical of this type of surround system with a very small amount of coil-out offset. Figure 8 shows the G12H’s KMS symmetry range curve. There is only 0.34-mm offset at rest increasing to only 0.37 mm at the physical XMAX position.
The G12H’s displacement limiting numbers, calculated by the Klippel analyzer, were XBl at 82% Bl = 2 mm and for XC at 75%, CMS minimum was 2.3 mm, which means the Bl is the most limiting factor at the prescribed distortion level of 10%.
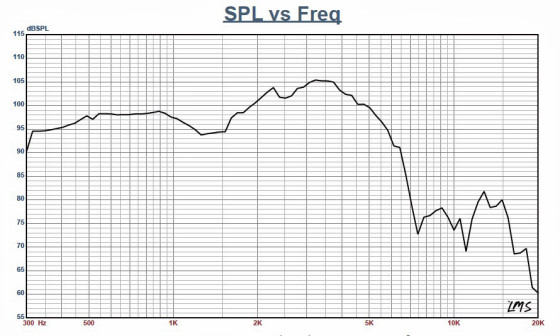
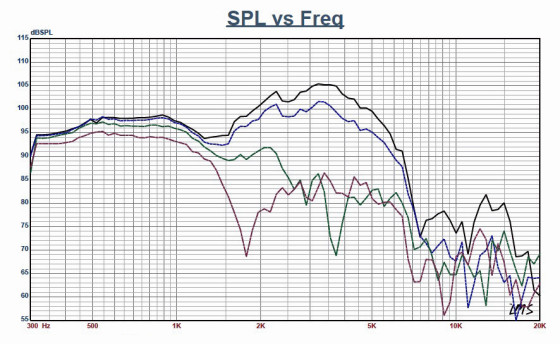
Next, I mounted the G12H in an enclosure with a 14” × 14” baffle filled with damping material (foam). Then, I measured the transducer on- and off-axis from 300-Hz-to-40-kHz frequency response at 2.83 V/1 m. I used the LinearX LMS analyzer set to a 100-point gated sine wave sweep. Figure 10 shows the G12H’s on-axis response, but there is no point to commenting on its SPL as often the anomalies are why it has a sound quality that guitarists really like! Figure 11 shows the on- and off-axis frequency response at 0°, 15°, 30°, and 45°.
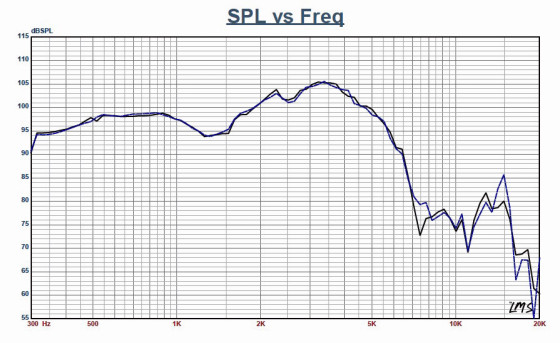
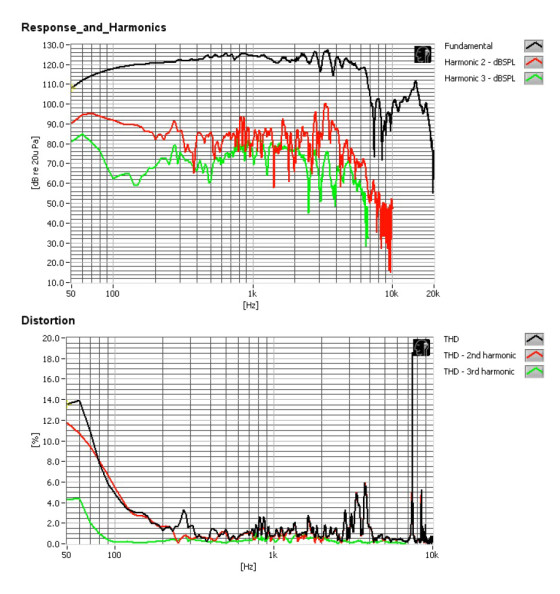
Figure 12 shows the two-sample comparison with this G12H sample pair appearing to be well matched. For the remaining series of tests, I used the Listen SoundCheck analyzer with the Listen 0.25” SCM microphone and power supply (courtesy of Listen, Inc.) to measure distortion and generate time frequency plots. For the distortion measurement, I rigidly mounted the G12H in free air, and used a noise stimulus to set the SPL to 104 dB at 1 m (7 V). I measured the distortion with the microphone placed 10 cm from the dust cap.
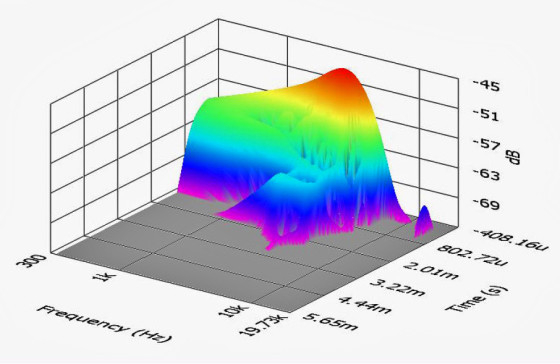
Figure 13 shows the distortion curves produced at the 104-dB setting. Then, I used SoundCheck to get a 2.83 V/1 m impulse response and imported the data into Listen’s SoundMap Time/Frequency software. Figure 14 shows the resulting CSD waterfall plot. Figure 15 shows the Wigner-Ville plot (which I used for its better low frequency performance).
I hope you enjoyed our look at this absolutely iconic guitar speaker from Celestion’s Heritage Series. The G12H(55) continues to be an extremely popular speaker for Celestion, which goes to prove that “if it ain’t broke, don’t fix it!” For more information, visit www.celestion.com.

This article was originally published in Voice Coil February 2015.