CEntrance DACportable Measurements by Stuart Yaniger
For the tests, I used an Audio Precision APx515 analyzer connected to an HP DC5700s desktop computer running Windows 7 SP1. The dummy loads for the headphone amplifier were made from 2 W non-inductive carbon composition resistors.
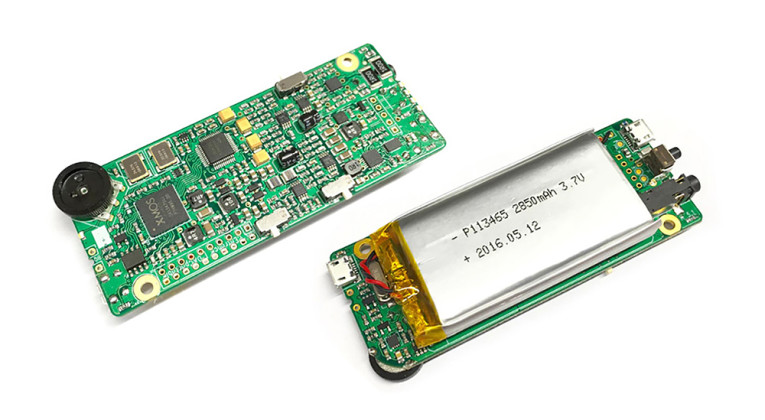
Photo 7: Take a look inside the DACportable.
Trials and Tribulations
To begin, let me say that the measurement phase of this review was a bit more of an adventure than I expected. The driver download indicated as “released” on the website and compatible with Windows 7 would not allow the DACportable to be correctly installed. After some correspondence with the helpful folks at CEntrance, I instead downloaded and installed the beta release driver indicated as compatible for Windows 10; this enabled the DACportable to be properly installed.
The first unit I received gave inconsistent and often very poor results when tested, and failed after a few days. CEntrance promptly replaced it with a second unit: All of the data shown here were acquired from this second unit.
The driver, called Universal Driver (UD), is quite picky about its playmates. When the DACportable is selected by the Audio Precision APx515 analyzer in ASIO mode, the Audio Precision software crashed spectacularly — something it did not do with any other DAC/driver combination I have used. This meant that the Audio Precision software could not be used as an ASIO source for the DACportable/UD ASIO combination. I tried using ARTA’s function generator as a source, and it also immediately crashed. When my 24 bit .wav files were played from foobar, they would only run as 16 bit. And using an M-Audio Delta 192 S/PDIF input with the DACportable output caused spectacular glitching.
As a workaround, I installed the DACportable on a second computer (a Lenovo T520 laptop with Windows 7 64-bit), then I used ARTA to generate .wav files of test signals on the laptop. Next, I played the test signals using J River Media center, which had no problem with the CEntrance ASIO driver. The output of the DACportable was then connected to the APx515’s analog inputs, with the APx515 connected to the Hewlett-Packard lab computer. This was a clumsy setup (three pieces of software and two computers), but it worked — other than an inability to do frequency or voltage sweep measurements controlled by the APx515 or with ARTA. The moral here is: You may want to check the compatibility of your software with the UD. The folks at CEntrance have promised to take a look at this, and if we can resolve it, I’ll post an update and sweep measurements (distortion vs. frequency, distortion vs. level, and crosstalk vs. frequency) on the audioXpress website.
Measurements
Moving on to the measurements, the DACportable has two gain settings (HI and LO). With a full scale input (0 dB) 1 kHz sine wave, maximum output into either a 600 Ω (600R) or 32 Ω (32R) load was 2.38 VRMS and 0.271 V, respectively. The CEntrance website gives 4.1 V as the maximum output specification, which is not met here. Nonetheless, the output is more than sufficient to drive the vast majority of headphones to ear-shattering levels. Source impedance at 1 kHz was 1.1 Ω, with a rise to 1.3 Ω at 10 kHz. This is sufficiently low that the frequency response with a headphone load will not significantly deviate from flat.
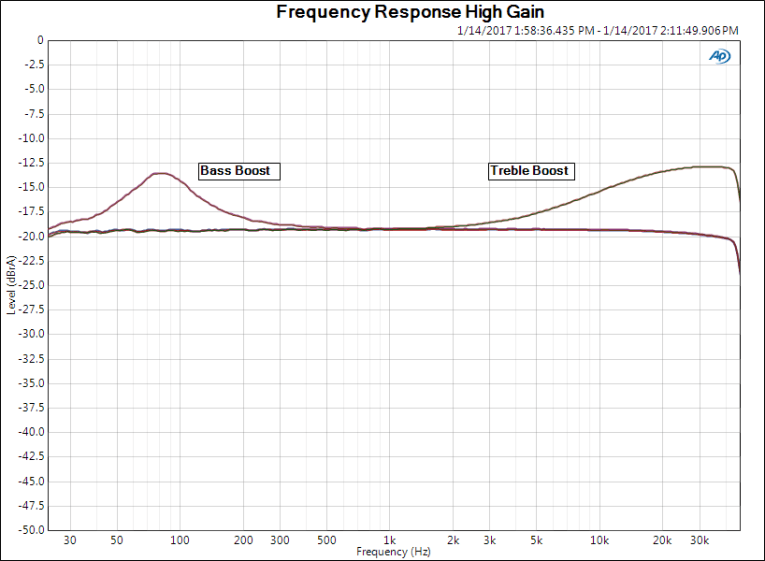
Figure 1: The frequency response of the DACportable can be varied from flat to treble boost to bass boost, depending on the switch settings.
Crosstalk at both 1 kHz and 10 kHz measured -56 dB. This is likely limited by the common return lead used for three wire (L, R, common) headphones rather than stray capacitive coupling, since the latter would show increasing crosstalk at higher frequencies. The DACportable also has two tone controls comprising bass and treble boost switches. Figure 1 shows the frequency responses with the boosts turned off and with the bass and treble boosts turned on, using a 600 Ω load and HI gain. These responses were acquired using white noise and power averaging at 96 kHz sample rate and 24 bit samples. As can be seen, the frequency response is quite flat with a slight roll-off at the frequency extremes, and the tone boosts give a very moderate (6 dB) enhancement. Changing the load to 32 Ω or the gain to LO have no effect on the frequency response.
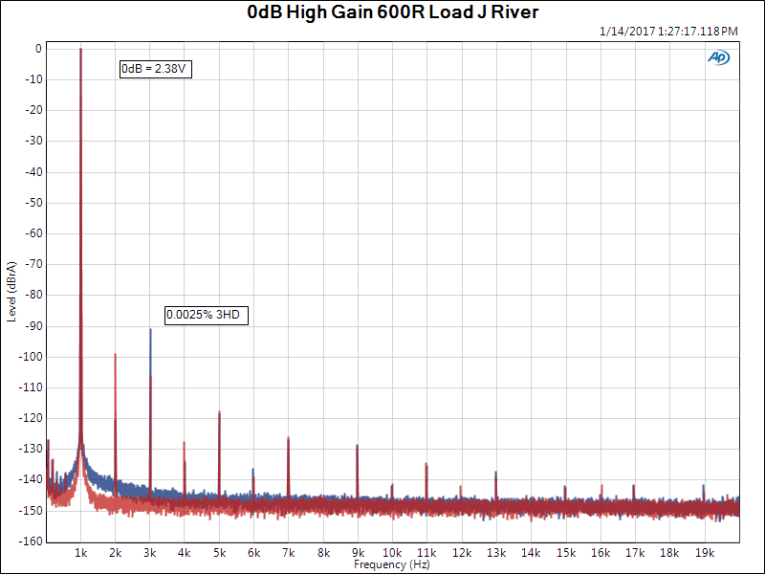
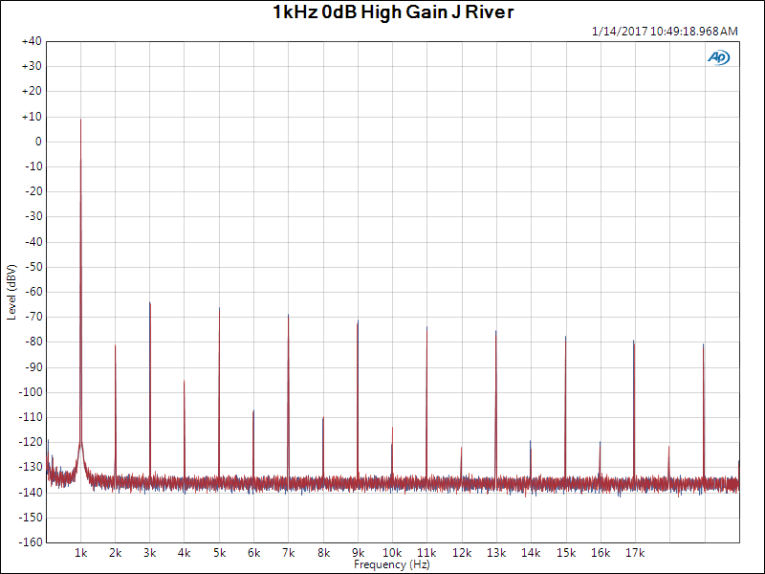
Figure 2: The spectrum for a full scale 1 kHz sine wave with a 600 Ω load (2.38 V out) shows very low distortion.
Figure 2 shows the distortion spectrum at 1 kHz and full output with a 600 Ω load. One channel is significantly worse than the other for third and fifth harmonics (indicating a symmetrical nonlinearity), but still clocks in at under 0.003% distortion. The spreading of the spectral skirts is also a little worse for that channel, but the artifacts are all under -130 dB from full scale, which is something smaller than negligible.
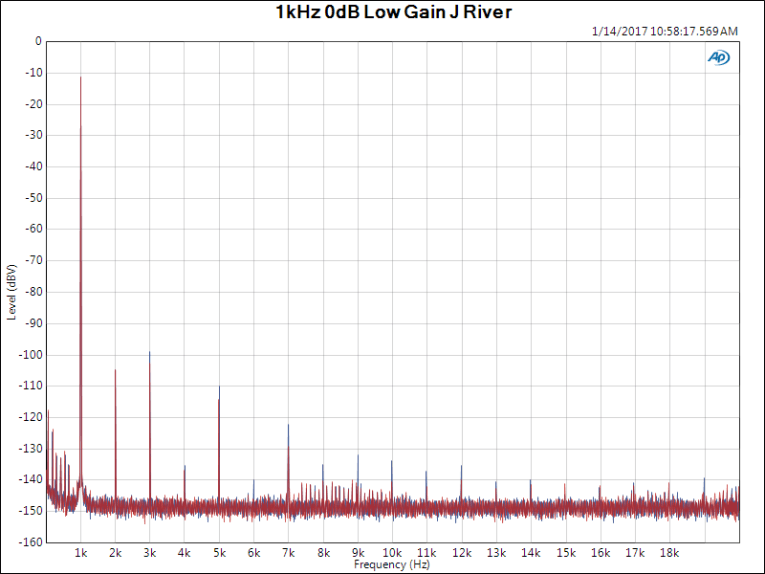
Figure 3: The spectrum for a full scale 1 kHz sine wave with a 32 Ω load (2.38 V out) shows increased distortion, mostly odd-order.
Figure 4: Reducing the DACportable output to 0.271 V (32 Ω load) significantly reduces distortion.
When the DACportable was loaded with 32 Ω, the distortion increased a bit (see Figure 3), but the worst harmonic (the third) is still 75 dB down from the fundamental (under 0.02%), an acceptable result. Figure 4 shows the distortion spectrum for the same full scale signal and 32 Ω load, but with the DACportable in LO gain mode. The distortion is significantly lower than with the DACportable in HI gain mode (0.004% for the third harmonic), suggesting that the distortion is dominated by the analog output stages.
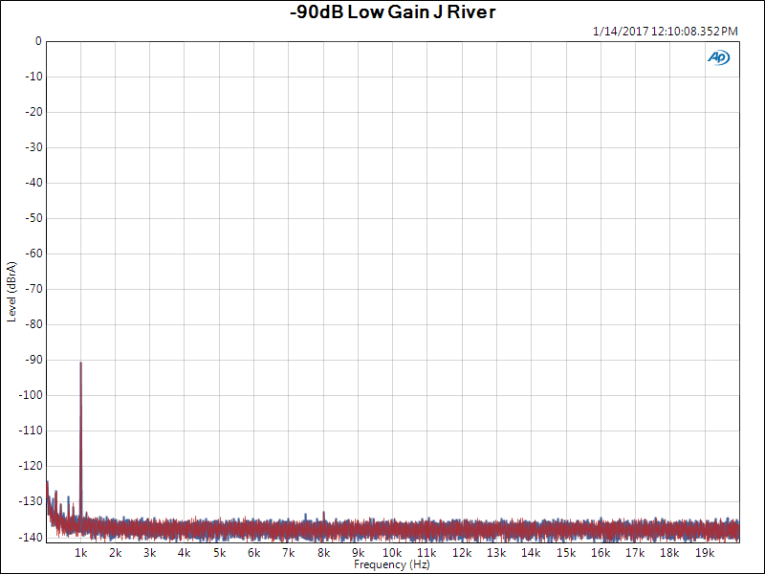
Figure 5: The spectrum for a sine wave at -90 dB appears perfectly clean, confirming excellent low-level linearity.
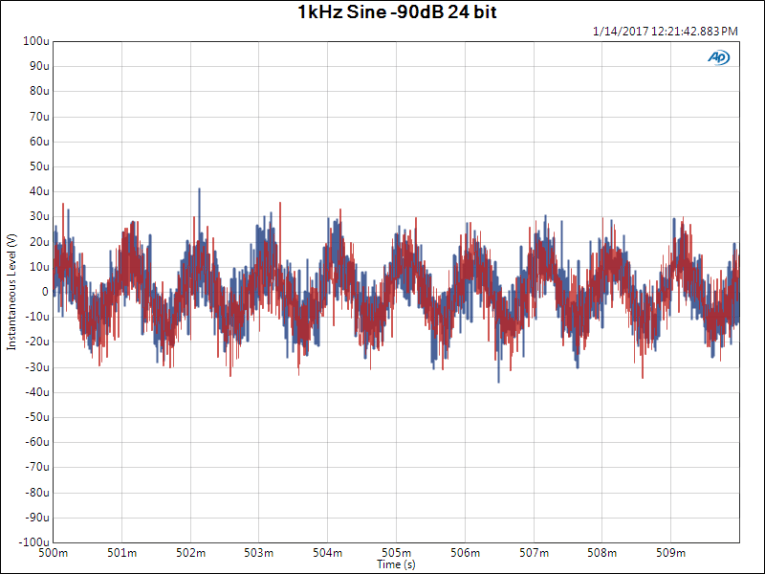
Figure 6: The waveform of a 1 kHz sine wave at -90 dB shows no indication of low-level errors or non-linearity.
Low-level performance was measured using a -90 dB 1 kHz sine wave, the spectrum of which is shown in Figure 5 for the DACportable set to LO gain and loaded with 32 Ω. This is perfectly clean, with an impressively low noise floor. This excellent result is reflected in the oscilloscope plot of the output, shown in Figure 6. You can see the sine wave overlaid with noise, with no signs of low level nonlinearity or crossover distortion.
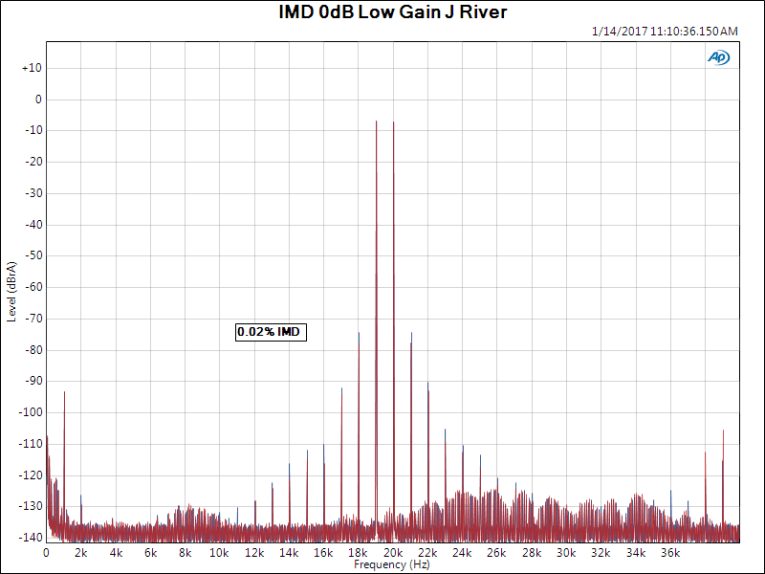
Figure 7: The DACportable’s 19/20 kHz IM distortion is quite low (0.02%) even at full output and a 32 Ω load.
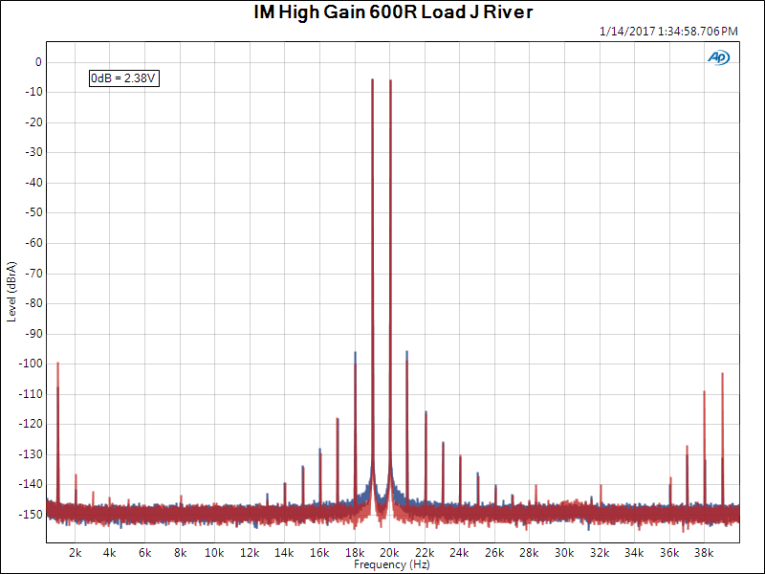
Figure 8: Increasing the load to 600 Ω reduces the full-scale IM distortion to 0.002%.
Figure 7 shows the intermodulation distortion (IM) spectra of the DACportable using a 1:1 19/20 kHz dual sine wave for the DACportable set to LO gain and full output with a 32 Ω load. Total IM was about 0.02%, again a very good number for this load. Increasing the load to 600 Ω and using the HI gain setting yielded the spectrum shown in Figure 8, which indicates IM to be less than 0.002% in the worse of the two channels at full output, an excellent result.
Figure 9: A multi-tone test with half-octave spacing at full output and a 600 Ω load shows a low noise floor and an almost complete absence of spuriae.
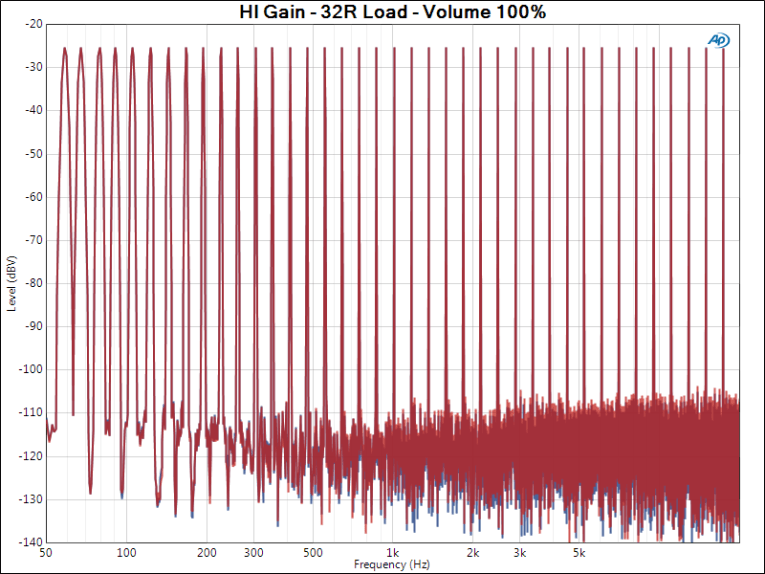
Figure 10: Changing the load to 32 Ω increases the distortion and the noise of the multi-tone signal spectrum, though they remain relatively low.
For multi-tone measurements, I used a test signal which is a series of tones spaced one-half octave apart. Misbehavior of electronics or excessive jitter will cause spurious tones to be created between the tones. Figure 9 shows the DACportable’s output spectrum at HI gain and full output into a 600 Ω load. It is impeccable, showing no spurious signals above -135 dBV. Dropping the load to 32 Ω, the results look a bit messier at full output (see Figure 10), but all the spurious signal lies at -110 dB and below so is unlikely to be of any audible consequence.
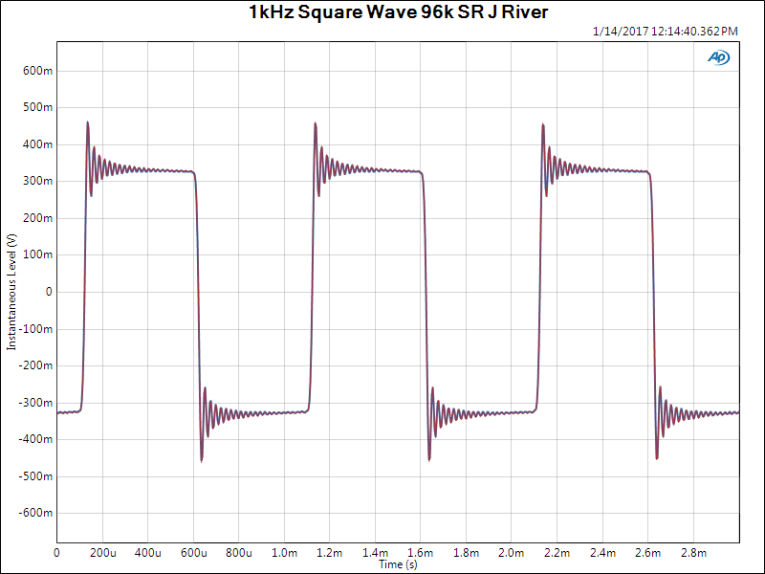
Square waves are diagnostic of the anti-imaging filters used in a DAC. Figure 11 shows the DACportable’s output for a 1 kHz square wave at a 96 kHz sample rate. The leading-edge ringing is typical of the Gibbs phenomenon seen with brick-wall filters. The square wave is otherwise clean and unremarkable. Likewise, Figure 12 shows an undithered square wave at a -90 dB level, and like the -90 dB sine wave shown previously, is clean and undistorted, but overlaid with the small amount of noise from the analog circuits. This is a fine result.
Figure 11: A full-scale square wave shows ringing on the leading edge, a characteristic of brick-wall filters.
Figure 12: A square wave at -90 dB demonstrates the DACportable’s low level linearity.
Conclusions
The DACportable turned in a first-rate set of measurements, with nothing to indicate anything less than complete audible transparency. If used with compatible software, its performance leaves little to be desired, especially with higher impedance headphones or headphones with normal efficiency. Oliver Masciarotte’s good impressions discussed in his article, are borne out by the measured performance. ax
This article was originally published in audioXpress, April 2017.
About the Author
Stuart Yaniger has been designing and building audio equipment for nearly half a century, and currently works as a technical director for a large industrial company. His professional research interests have spanned theoretical physics, electronics, chemistry, spectroscopy, aerospace, biology, and sensory science. One day, he will figure out what he would like to be when he grows up.
Oliver A. Masciarotte has spent more than 40 years immersed in the tech space, working on manufacturing, marketing, and product development for many pro and CE audio manufacturers including dbx, a/d/s, Lexicon, Sonic Solutions, and Minnetonka Audio. His client... Read more