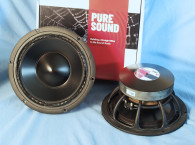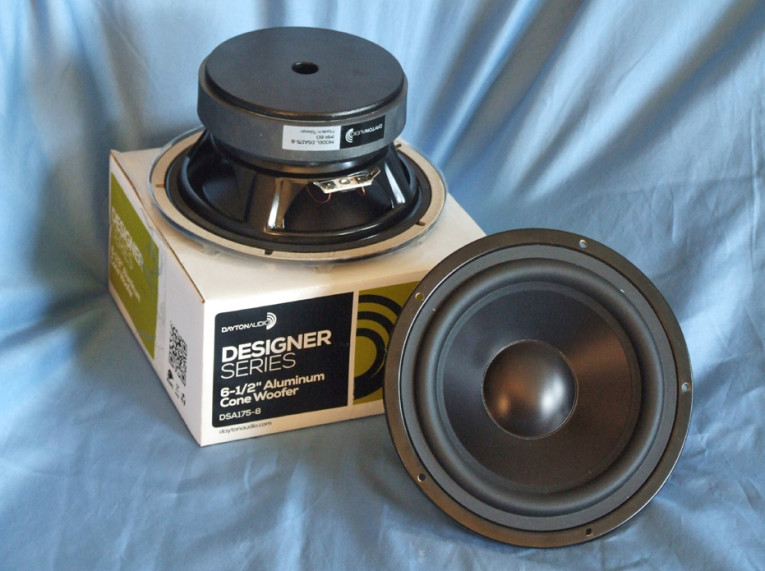
Features for the Dayton Audio DSA175 are fairly impressive. Starting with the frame, Dayton Audio has devised a proprietary four-spoke surface-mountable stamped steel basket, however, it does not incorporate any below-the-spider venting. Cooling is provided by a 15 mm diameter pole vent. The cone assembly consists of a black anodized straight-edge aluminum cone and a 52 mm (2.125”) diameter convex aluminum dust cap. Compliance is provided by a positive roll nitrile-butadiene rubber (NBR) surround while the remaining compliance comes from a 3.5” diameter elevated cloth spider.
The DSA175’s motor design utilizes a 22 mm × 120 mm ferrite ring magnet, a vented pole piece fitted with a copper shorting ring (not specified by probably a copper pole cap). Driving the cone assembly is a 35.5 mm diameter voice coil wound with round copper wire on an aluminum former. Last, the voice coil is terminated at standard set of solderable terminals. This is basically a nicely configured budget-priced line of drivers, with the single piece retail price of $36.90.
I commenced analysis of the DSA175 using the LinearX LMS analyzer and VIBox to create the voltage and admittance (current) curves with the driver clamped to a rigid test fixture in free air at 0.3, 1, 3, 6, 10, and 15 V. The driver remained acceptably linear enough for LEAP 5 to curve fit at 15 V, which is impressive for any 6.5” woofer. I should note that the DSA175 will physically bottom (the voice coil former hitting the back plate or the spider hitting the front plate); however, the suspension has been configured such that this should not be a problem.
Following my established Test Bench protocol, I no longer use a single added mass measurement. Instead, I use the physically measured Mmd data (23.4 grams for the DSA175). I post-processed the 12 550-point stepped sine wave sweeps for each DSA175 sample and divided the voltage curves by the current curves to generate impedance curves, with the phase derived using the LMS calculation method. I imported the data, along with the accompanying voltage curves, into the LEAP 5 Enclosure Shop software.
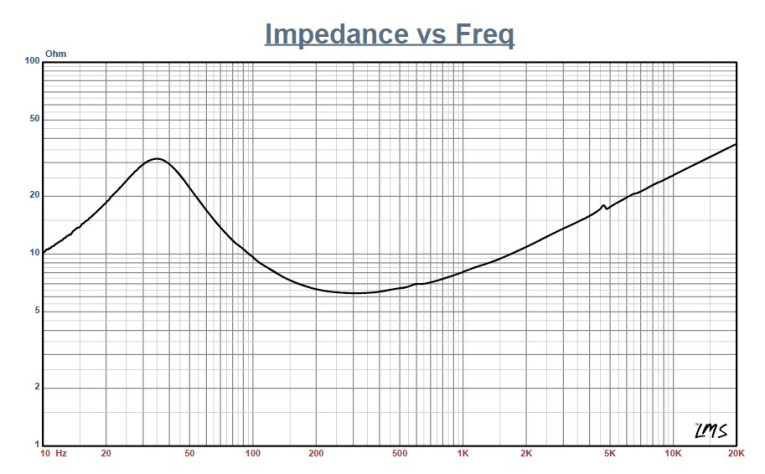
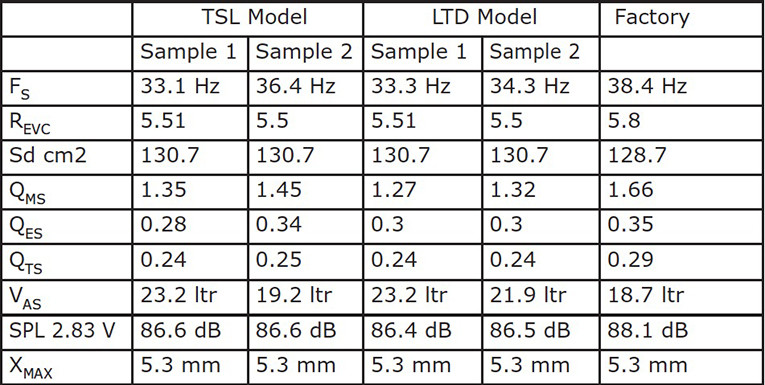
Because Thiele-Small (T-S) data provided by the majority of OEM manufacturers is generated using either the standard model or the LEAP 4 TSL model, I additionally created a LEAP 4 TSL parameter set using the 1 V free-air curves. I selected the complete data set, the multiple voltage impedance curves for the LTD model, and the 1 V impedance curve for the TSL model in the transducer parameter derivation menu in LEAP 5 and created the parameters for the computer box simulations. Figure 1 shows the 1 V free-air impedance curve. Table 1 compares the LEAP 5 LTD and TSL data and factory parameters for both of the DSA175 samples.
The DSA175’s LEAP parameter calculation results aligned reasonably well with the factory published data. However, I followed my usual protocol and set up computer enclosure simulations, using the LEAP LTD parameters for Sample 1. I programmed two computer box simulations into LEAP 5 — one was the factory recommended sealed box with a 0.1-ft3 volume (50% fill material) and the other was a vented Extended Bass Shelf (EBS) enclosure with a 0.38-ft3 volume simulated with 15% fiberglass damping material and tuned to 47 Hz.
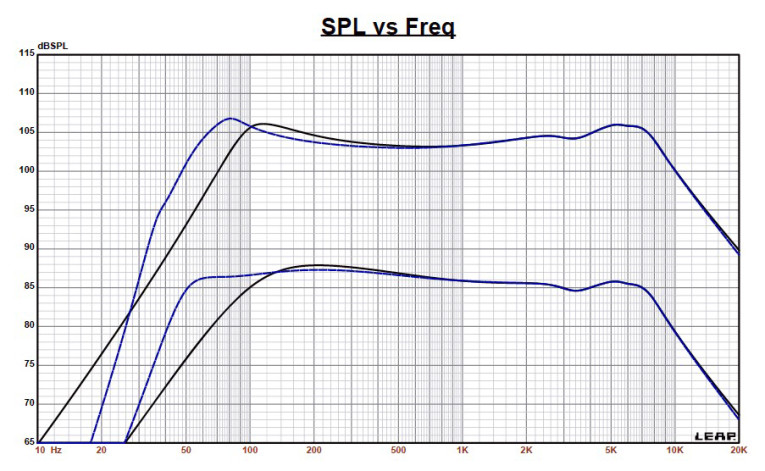
Figure 2 displays the results for the DSA175 in the two enclosures at 2.83 V and at a voltage level sufficiently high enough to increase cone excursion to 6.1 mm (Xmax + 15%). This produced a F3 frequency of 98 Hz (F6 = 75 Hz) with a Qtc = 0.68 for the factory recommended sealed enclosure and –3 dB = 46.5 Hz (F6 = 41.6 Hz) for the ported box simulation.
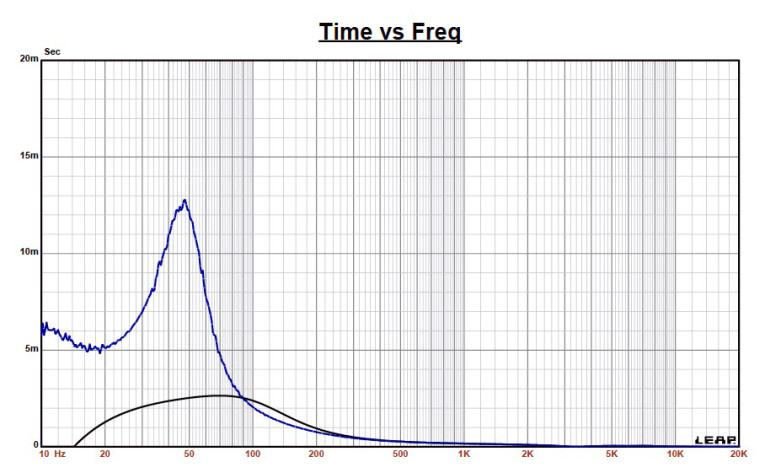
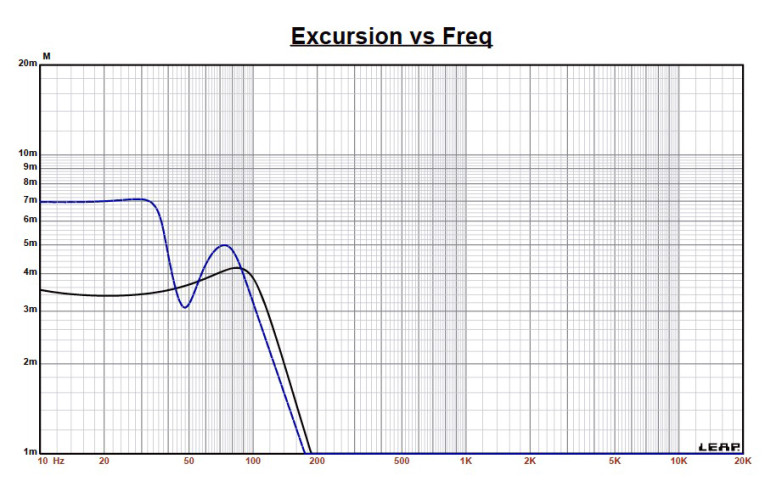
Increasing the voltage input to the simulations until the maximum linear cone excursion was reached resulted in 106 dB at 40 V for the factory recommended box and 107 dB for the same 40 V input level for the larger vented box. Figure 3 shows the 2.83 V group delay curves. Figure 4 shows the 40 V excursion curves. As can be seen in the excursion curves, neither simulation really got close to the Xmax + 15% number, as the DSA175, like the other models in the Designer Series are thermally limited by their configuration, and indeed this is partly a sales feature of the Dayton Audio Designer Line.
As stated on the Dayton Audio website, “Careful engineering ensures that each speaker in the series is capable of handling full rated power at the lowest possible frequencies — without exceeding Xmax.”
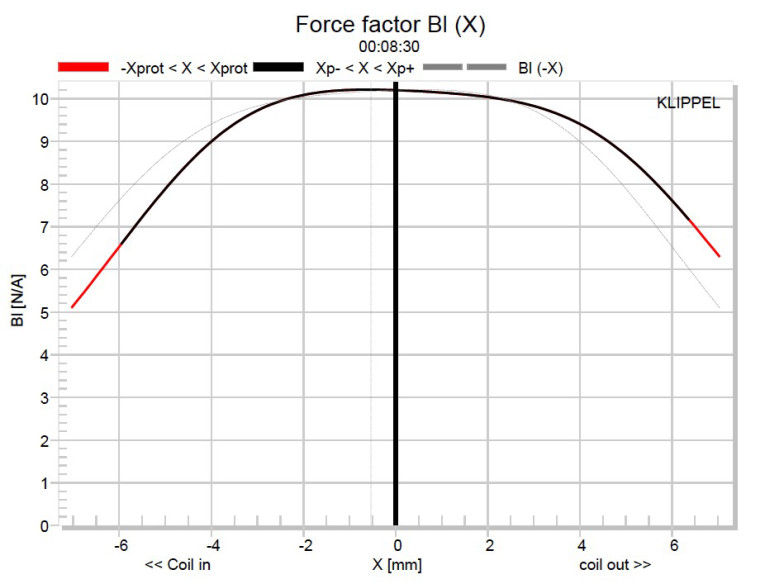
Klippel analysis for the DSA175 produced the Bl(X), Kms(X), and Bl and Kms symmetry range plots given in Figures 5–8. Our analyzer is provided courtesy of Klippel GmbH. The analysis is performed by Pat Turnmire, of Redrock Acoustics. The DSA175’s Bl(X) curve (see Figure 5) is moderately broad, especially for a 6.5” woofer, and nicely symmetrical, with a small amount of offset.
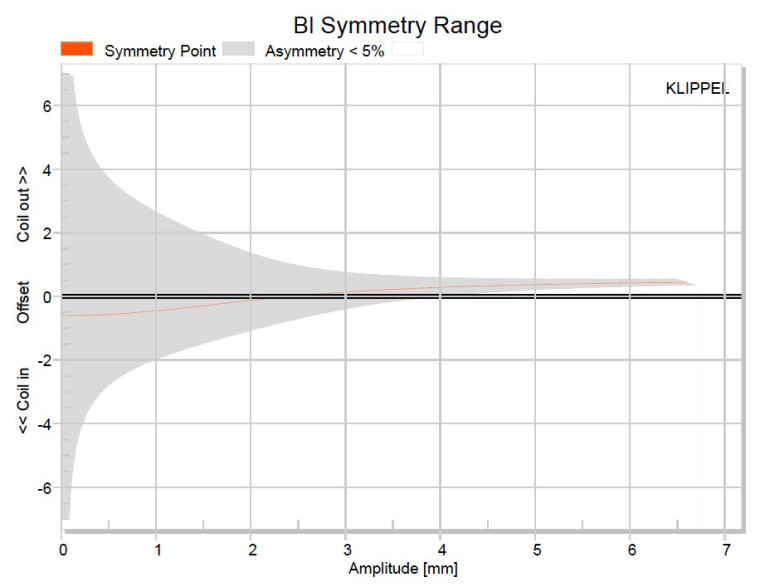
Looking at the Bl symmetry plot (see Figure 6), this curve shows a small 0.23 mm coil-out offset at the 3.5 mm position (an area of reasonable certainty) increasing to a likewise trivial 0.25 mm coil-out offset at the physical Xmax position that stays mostly constant throughout the driver’s remaining operating range.
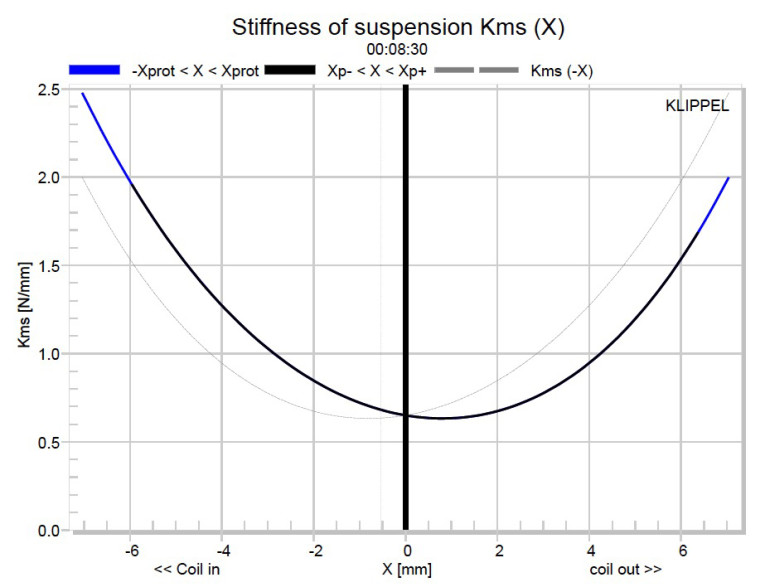
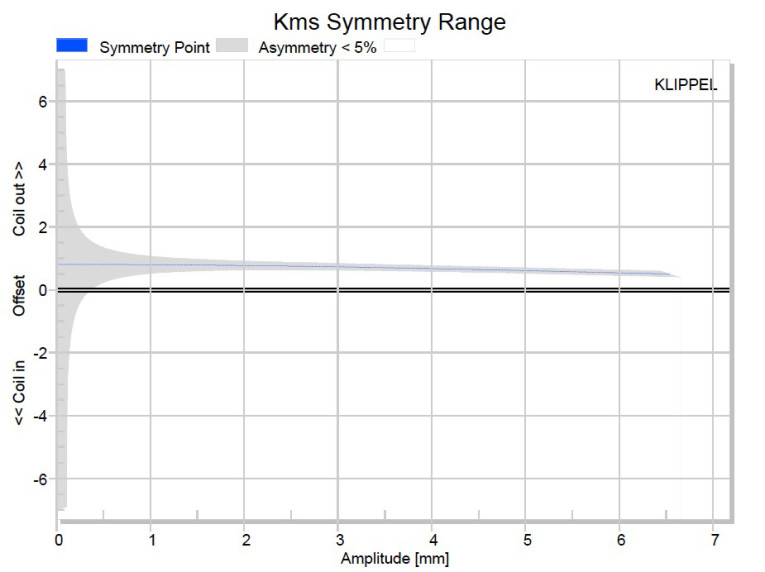
Figure 7 and Figure 8 show the Kms(X) and the Kms symmetry range curves. The Kms(X) curve is somewhat asymmetrical, as well as having an obvious, but not large offset. With the Kms symmetry range plot, there is a 0.80 mm coil-out (forward) offset 1.3 mm (an area of reasonable certainty, indicated by the shaded grey area) staying more or less constant out to the physical Xmax where it decreases slightly to 0.72 mm.
The DSA175’s displacement limiting numbers were XBl at 82% Bl = 4.6 mm and for crossover (XC) at 75% Cms minimum was 2.1 mm, which means that for this Dayton home audio driver, the compliance is the most limiting factor for prescribed distortion level of 10%. Again, 10% may be a somewhat conservative criteria given the relative difficulty of perceiving total harmonic distortion (THD) subjectively, so if we apply the 20% distortion criteria with Bl decreasing to 70% and compliance decreasing to 50%, then the numbers are XBl = 5.6 mm and XC = 4.1 mm.
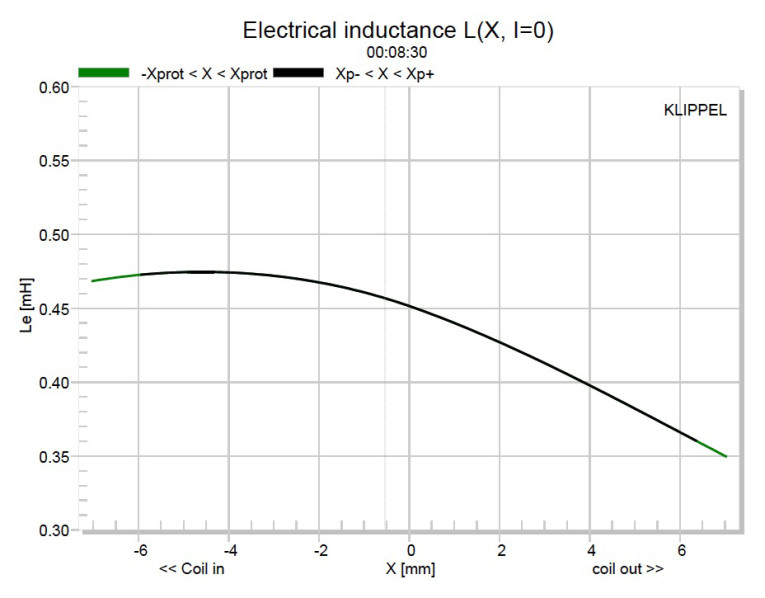
Figure 9 gives the inductance curves Le(X) for the DSA175. Inductance typically increases in the rear direction from the zero rest position as the voice coil covers more pole area. However, with a copper shorting ring installed in the DSA175, the inductance swing for this driver is a maximum of 0.08 mH, which is definitely good for minimizing distortion.
With the Klippel testing completed, I mounted the DSA175 in a foam-filled enclosure that had a 15” × 8” baffle. Then, I used the LinearX LMS analyzer set to a 100-point gated sine wave sweep to measure the device under test (DUT) on and off axis from 300 Hz to 20 kHz at 2.83 V/1 m.
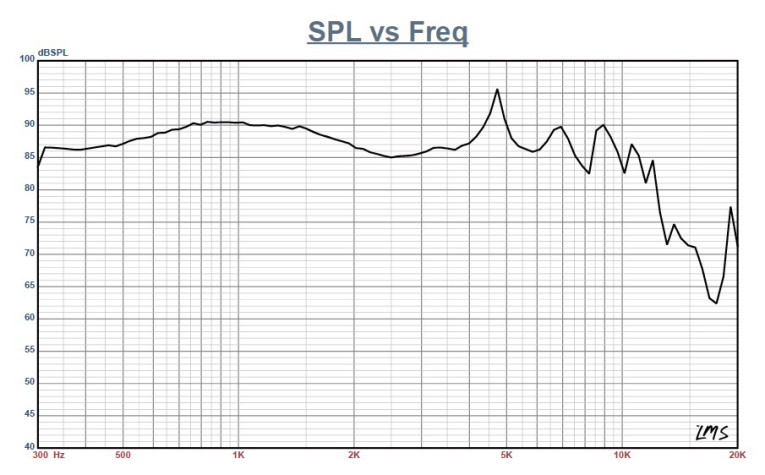
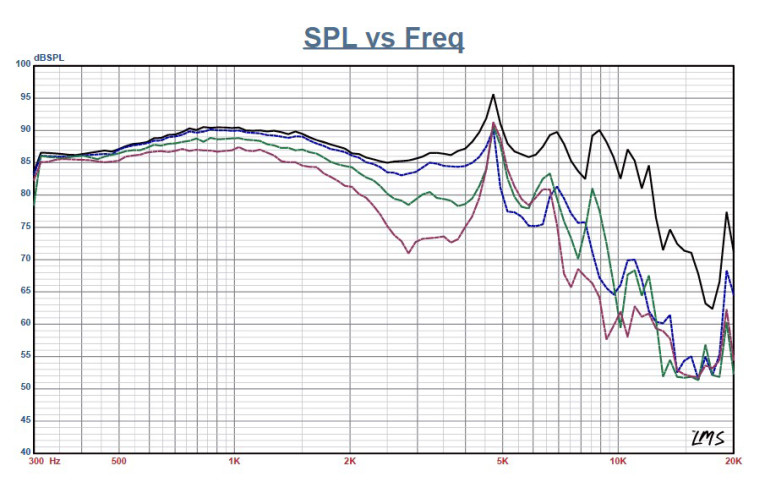
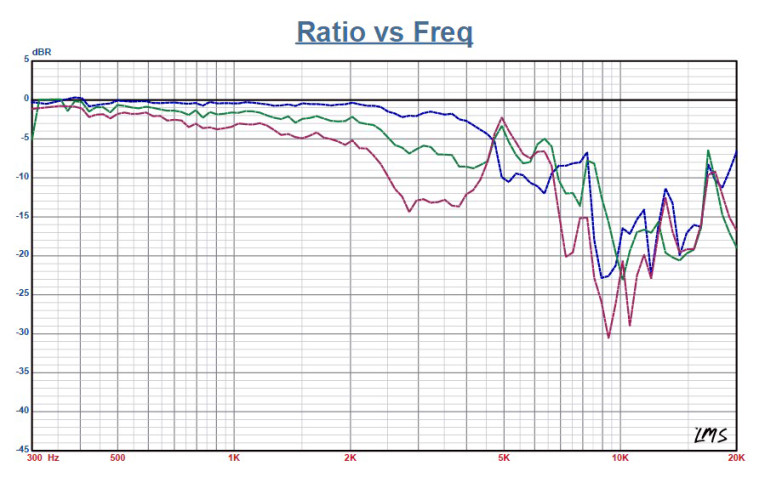
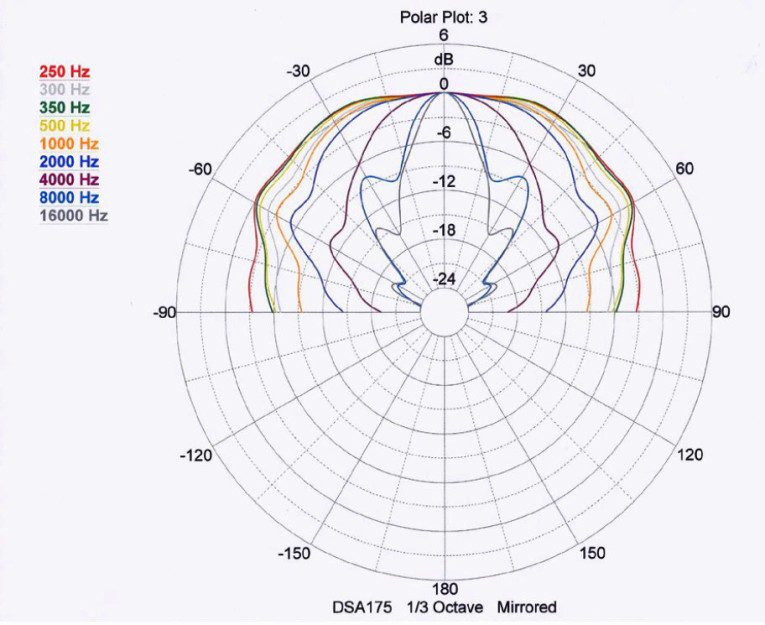
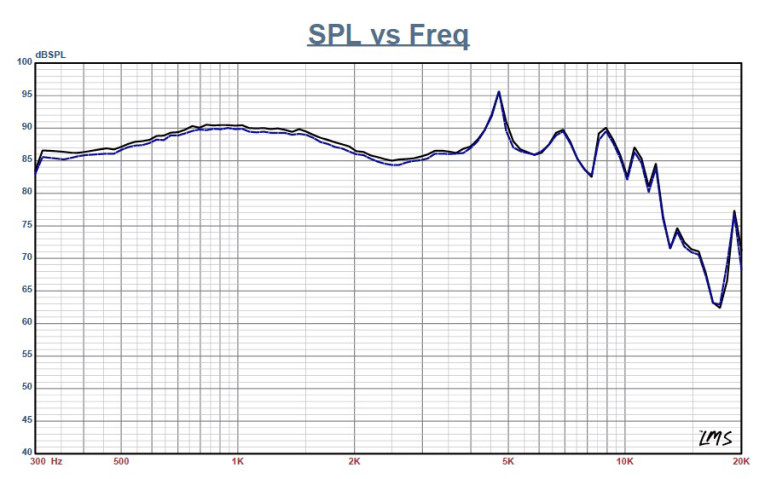
Figure 10 gives the DSA175’s on-axis response indicating a smoothly rising response that is ±2.7 dB from 300 Hz to 4.3 kHz, with a 7 dB breakup mode centered on 4.7 kHz as the driver begins its lowpass rolloff. Figure 11 displays the on- and off-axis frequency response at 0°, 15°, 30°, and 45°, showing the typical directivity for a 6.5” woofer. Figure 12 gives the normalized rendition of Figure 23, while Figure 13 displays the CLIO horizontal polar plot (in 10° increments). Figure 14 gives the two-sample SPL comparisons, indicating a close match throughout the operating range.
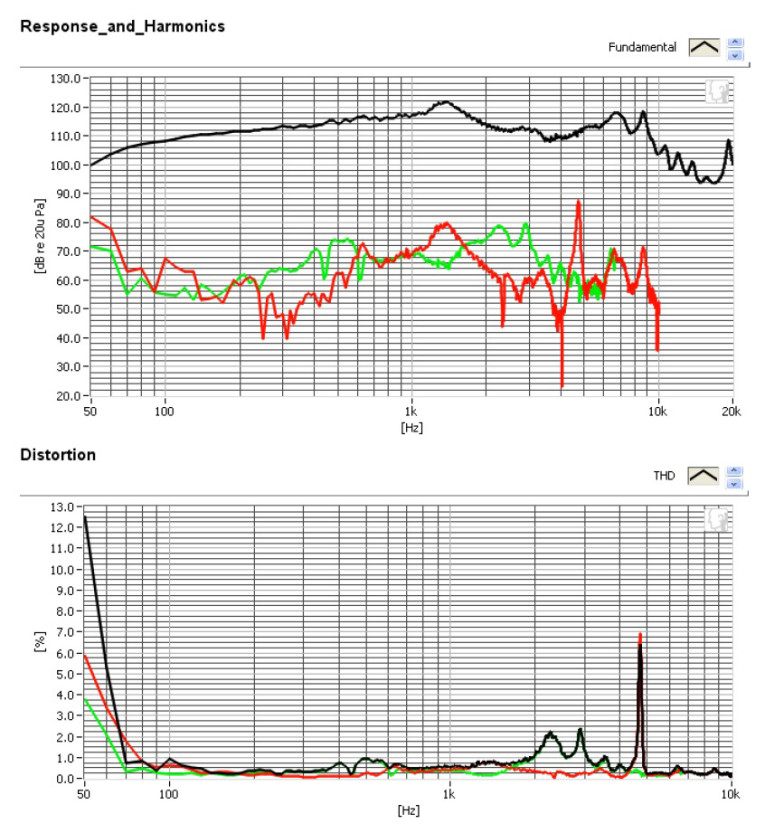
For the remaining tests, I used the Listen SoundCheck AmpConnect analyzer and the SCM microphone to measure distortion and generate time frequency plots. For the distortion measurement, I mounted the DSA175 rigidly in free air, and used a pink noise stiumulus to set the SPL to 104 dB at 1 m (7.02 V). Then, I measured the distortion, with the Listen microphone placed 10 cm from the driver. This produced the distortion curves shown in Figure 15.
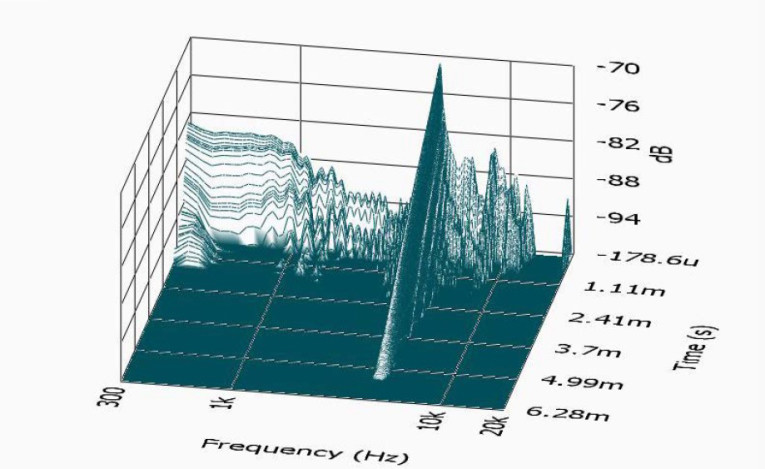
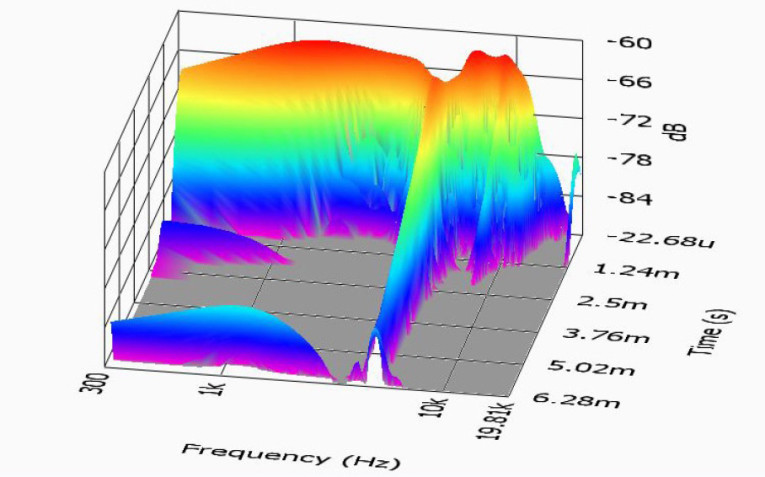
I then used SoundCheck to get a 2.83 V/1 m impulse response and imported the data into Listen’s SoundMap Time/Frequency software. Figure 16 shows the resulting CSD waterfall plot. Figure 17 shows the Wigner-Ville plot (for its better low-frequency performance).
Dayton Audio has produced several interesting OEM products that are cost effective, especially for low-volume manufacturers. The Designer Series is a good example, representing nice functionality at a desirable price point. For more information, visit www.daytonaudio.com. VC
This article was originally published in Voice Coil, December 2016.