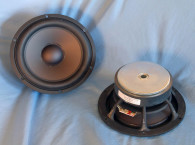
The 10” Accucenter (Morel’s proprietary cone assembly centering system) self-centering cone assembly includes a one piece stiff composite cellular fiber formulation cone with a 120 mm (4.75”) diameter cellular fiber dust cap driven by a 130 mm (5.1”) diameter two-layer voice coil wound with Hexatech aluminum wire on a vented titanium former. This large voice coil, at least large for a 10” woofer, provides a high power handling rating for this driver. Morel rates the nominal power handling of the TiCW 1058Ft at 600 W DIN. Incidentally, this driver’s car audio version, the Ultimo Titanium 10” subwoofer, received the European Imaging and Sound Association’s 2014-2015 Best Product award. Compliance is provided by a nitrile butadiene rubber (NBR) high excursion surround, and a 7” diameter flat cloth spider, both part of Morel’s Progressive Field Symmetry system. As the name implies, this is a progressive type suspension system that provides increased resistance at the extremes of voice coil travel.
All this is powered by rather unique motor dual motor structure, trademark Morel technology that uses two stacked 22 mm thick by 135 mm diameter ferrite magnets on the back side of the front plate with a large copper-sleeved neodymium ring magnet on the front side of the front plate, both located on the inside of the voice coil former. As such, the gap is located on the magnet structure’s outside perimeter rather than at the center of the magnet structure as are the majority of woofer motors. This eliminates the entire pole piece that is normally used to create the gap field.
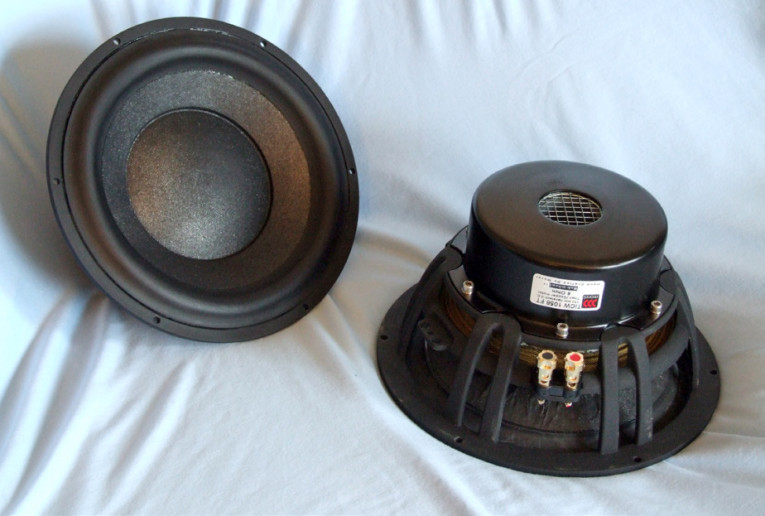
Because this unique motor structure does not rely on a standard pole piece to complete the circuit, what appears to be a pole vent is actually a view down the magnet array. However, this provides an additional cooling path via a 42-mm diameter vent hole. The entire motor assembly is held in place by a bolted down motor cup, giving the appearance of a shielded motor cup. Last, the two sets of braided voice coil lead wires terminate to a pair of gold color-coded push terminals.
I began characterizing the Morel TiCW 1058Ft 10” subwoofer with the LinearX LMS analyzer and VIBox. I generated the voltage and the admittance (current) measurements in free-air at 0.3, 1, 3, 6, 10, 15, 20, and 30 V. Please also note that this multi-voltage parameter test procedure includes heating the voice coil between sweeps for progressively longer periods to simulate operating temperatures at that voltage level (raising the temperature to the third time constant).
I dropped the 30-V curves as they were too nonlinear for LEAP 5 to get a good curve fit. I further processed the remaining 14 sine wave sweeps for each woofer and divided the voltage curves by the current curves to produce impedance curves. I used the LEAP phase calculation routine to generate the phase curves. Then, I copy/pasted the impedance magnitude and phase curves plus the associated voltage curves into the LEAP 5 software’s Guide Curve library. I calculated the parameters using the LEAP 5 LTD transducer model.
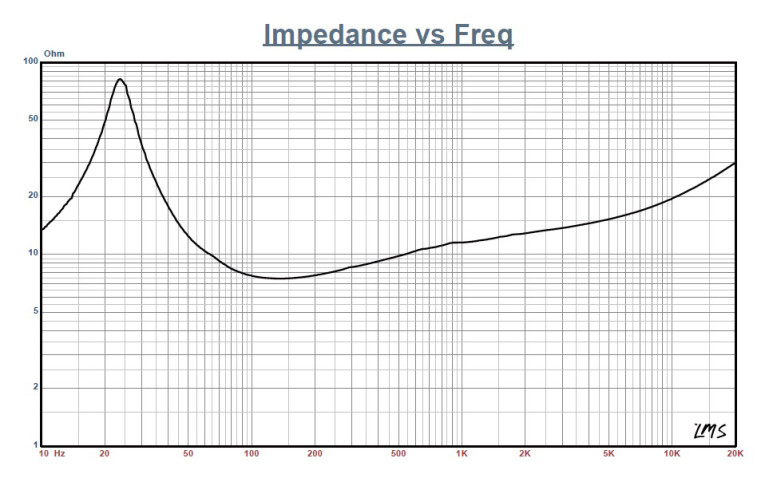
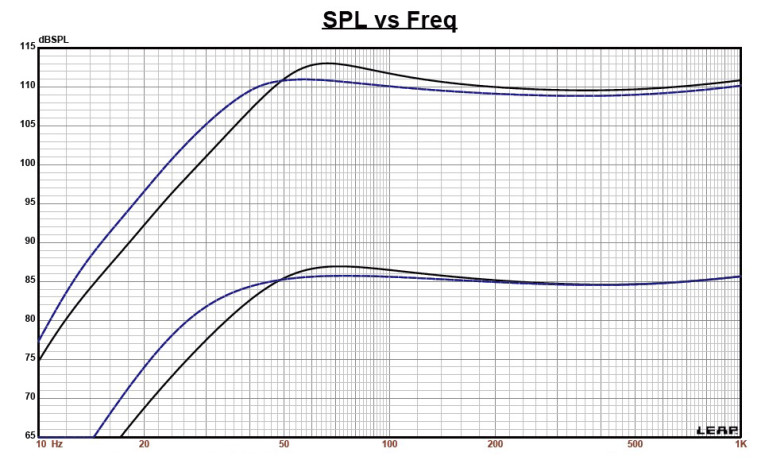
Because most manufacturing data is produced using a standard transducer model or the LEAP 4 TSL model, I also generated LEAP 4 TSL model parameters using the 1 V free air that can be compared with the manufacturers data. Figure 1 shows 1 V free-air impedance plot). Table 1 compares the LEAP 5 LTD and LEAP 4 TSL Thiele-Small (T-S) parameter sets for the two Morel TiCW 1058Ft driver samples along with the Morel factory data.


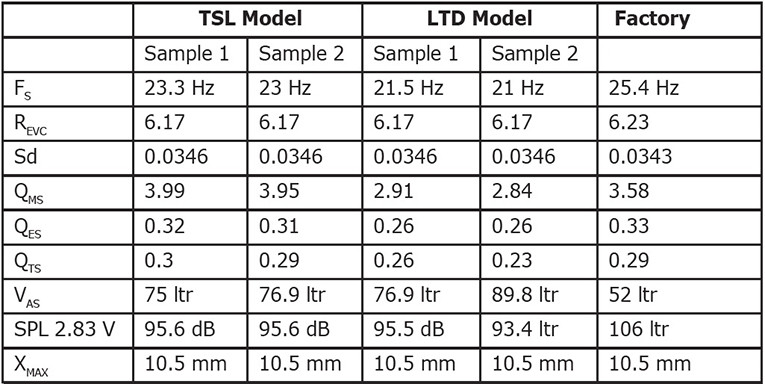
From the TiCW 1058Ft subwoofer’s comparative data shown in Table 1, you can see that all four parameter sets for the two samples were reasonably similar, and correlated well with the factory parameters. As usual, I used the Sample 1 LEAP 5 LTD parameters and set up two computer box simulations, one in a 0.75 ft3 QB3 type vented enclosure with 15% fill material (fiberglass) tuned to 30.5 Hz and a second vented box, an Extended Bass Shelf (EBS) alignment in a 1.5 ft3 box with 15% fill material and tuned to 26 Hz. Since these are low-tuning frequencies for relatively small enclosures, the Morel 10” is a good candidate for passive radiator designs.
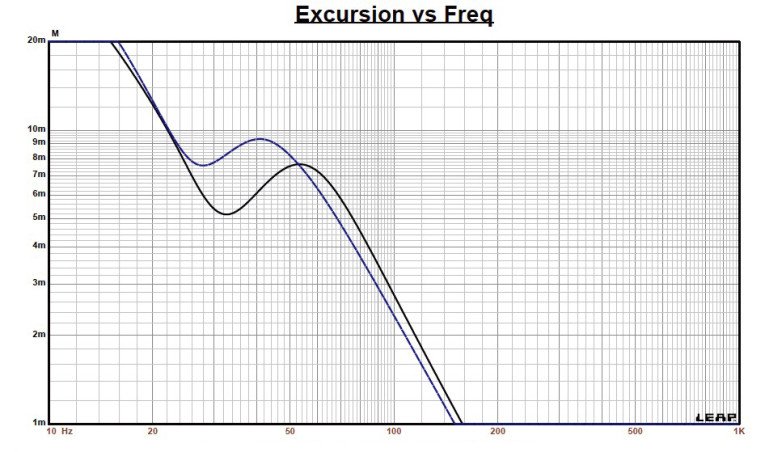
Figure 2 shows the results for the Morel TiCW 1058Ft in the two vented enclosures at 2.83 V and at a voltage level high enough to increase cone excursion to 12 mm (XMAX + 15%). This resulted in a F3 of 43.8 Hz (–6 dB = 36 Hz) for the QB3 simulation, and for the 1.5 ft3 EBS enclosure a –3dB at 32 Hz (–6 dB = 26 Hz). Increasing the voltage input to the simulations until the approximate XMAX + 15% maximum linear cone excursion point was reached resulted in 113 dB with a 63-V input for the 0.75-ft3 simulation, and a 111 dB with the 56-V input level for the larger vented box. Figure 3 shows the 2.83-V group delay curves. Figure 4 shows the 63/56 V excursion curves.
The Morel TiCW 1058Ft 10” subwoofer Klippel analysis produced the Klippel data graphs, which are shown in Figures 5–8. Our analyzer is provided courtesy of Klippel GmbH and Patrick Turnmire of Redrock Acoustics performed the tests. (If you do not own a Klippel analyzer and would like this type of data, Redrock Acoustics can provide Klippel analysis for almost any driver. For more information, visit www.redrockacoustics.com.)
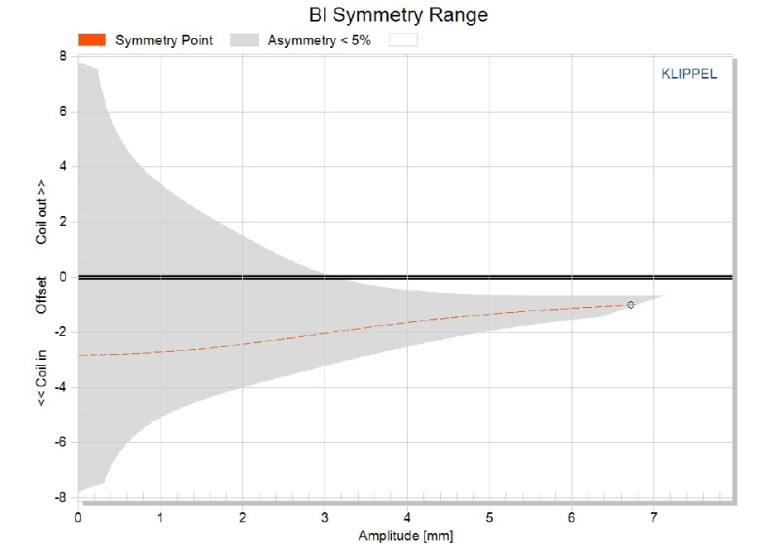
The Morel TiCW 1058Ft’s Bl(X) curve, shown in Figure 5, is very broad and mostly symmetrical with a slight tilt, typical of a driver with substantial XMAX. The Bl symmetry curve shown in Figure 6 has a small 1-mm Bl coil-10 (rearward) offset at 6.5 mm, which was a reasonable area of certainty for the analyzer.
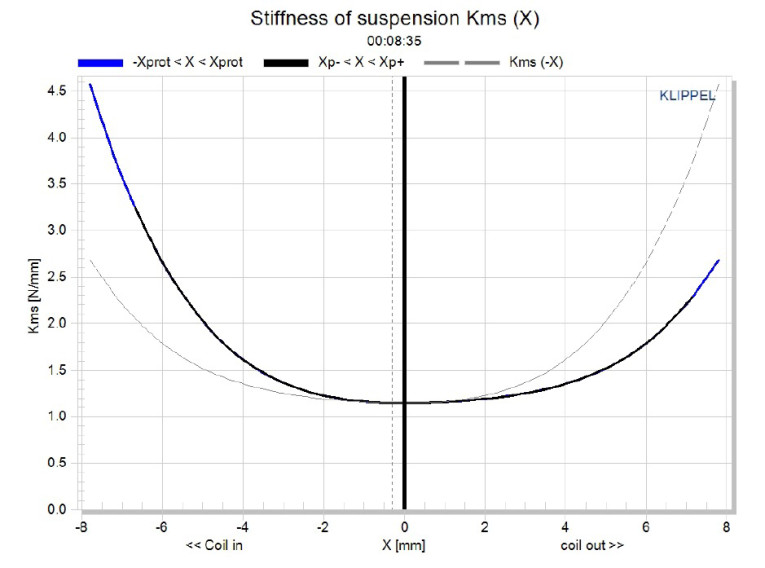
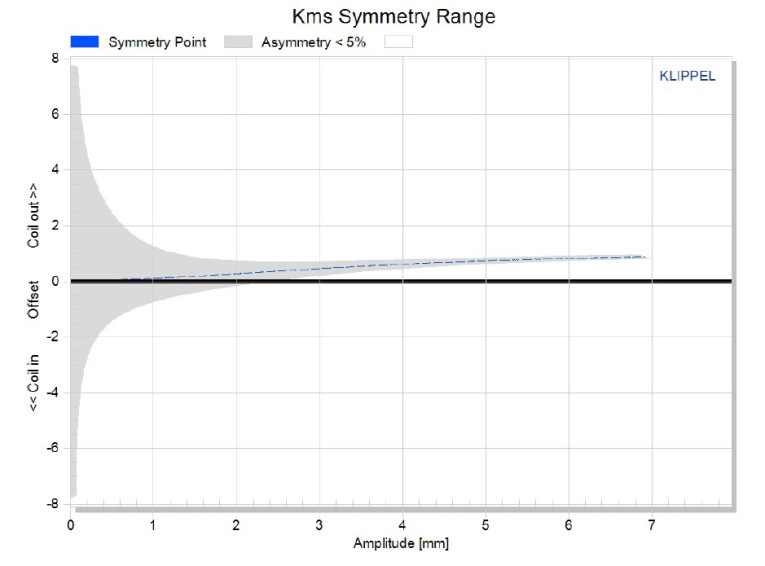
Figure 7 shows the KMS(X), which definitely has a degree of asymmetry, with small amount of coil-out offset. Figure 8 shows the KMS symmetry curve, which indicates a trivial 0.9-mm coil-out (forward) offset with a high degree of certainty at the 6.5-mm excursion point. However, because of the progressive nature of this suspension, the Klippel analyzer did not graph data beyond 8 mm for Bl or compliance.
The TiCW 1058Ft’s displacement limiting numbers calculated by the Klippel analyzer using the subwoofer criteria for Bl was XBl at 70% (Bl dropping to 70% of its maximum value) equal to greater than 6.7 mm for the prescribed 20% distortion level (the criterion for subwoofers). For the compliance, crossover (XC) at 50% CMS minimum was 5.5 mm (less than the physical XMAX of this driver). For the Morel driver, this means the compliance is the most limiting factor for getting to the 20% distortion level.
While it is obvious the compliance is being limited by the relatively small spider (7” outer diameter, 5.1” inner diameter), compliance induced distortion is the least offending type of driver distortion of all the various elements that contribute to distortion.
And, high levels of subwoofer distortion that exceed 20% are just really not that subjectively hearable, which is a point that has been frequently made by some well respected industry engineers. So while this driver does not fit a lot of conventional criteria, it is an extremely well constructed, high power handling 10” subwoofer (600 W nominal DIN rated), that will, because of the progressive compliance braking resulting from the tight suspension, take a licking and keep on ticking.
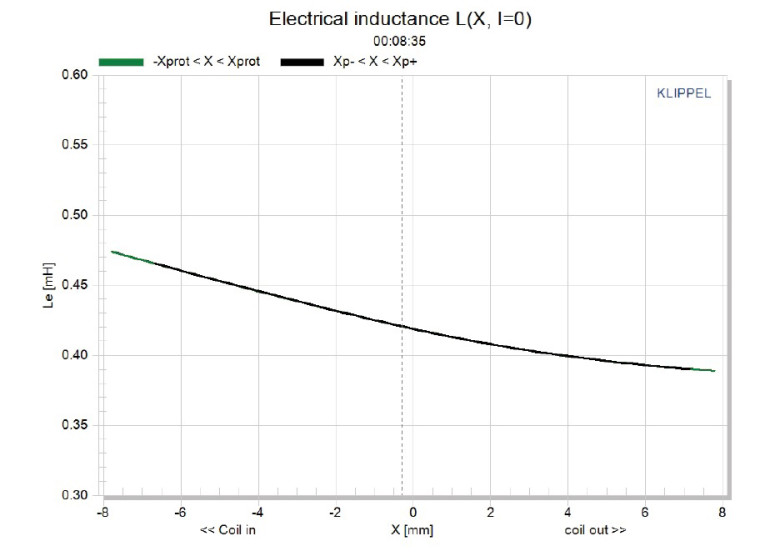
Figure 9 shows the inductance curve Le(X). Motor inductance will typically increase in the rear direction from the zero rest position and decrease in the forward direction as the voice coil moves out of the gap and has less pole coverage. This criteria is of course difficult to apply to a proprietary technology that does not use the typical pole/gap format. What we do get is a minor inductance variation, in part due to the copper shorting ring (Faraday shield) for the neodymium magnet in the motor assembly. Although the data is limited to only ±7 mm due to the compliance stiffness, the inductive variation is only 0.047 mH coil-in and 0.030 mH coil-out, which equates to extremely low inductive distortion, an obvious goal for high-performance woofer design.
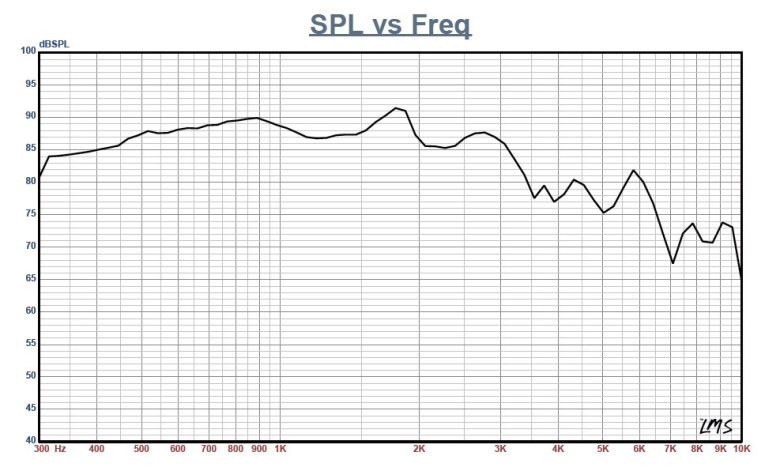
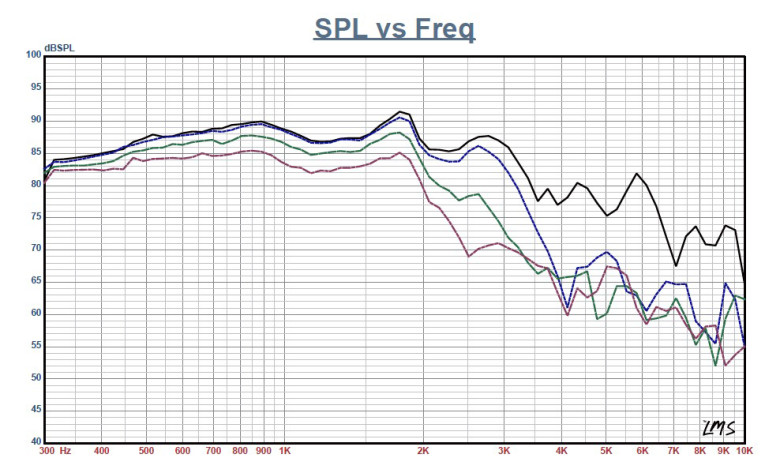
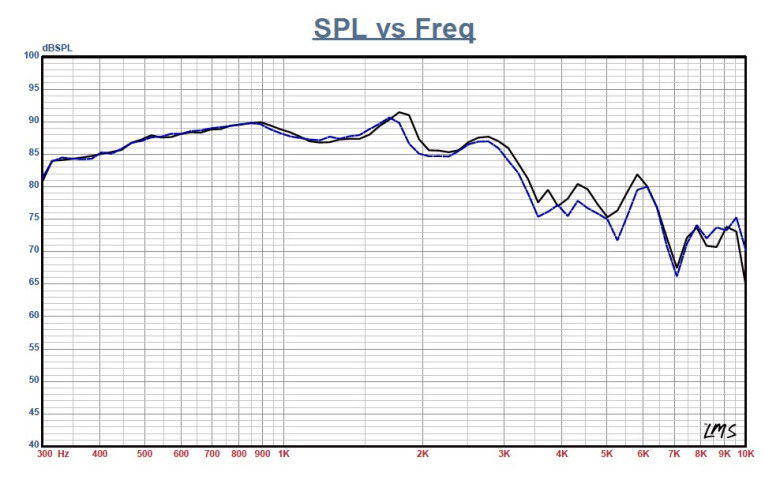
Normally, I mount the driver in a box and measure the on- and off-axis sound pressure level (SPL). But, I generally do not do this for subwoofers, as they usually are crossed over at 100 Hz or lower. However, the Morel TiCW plays high enough to be quite useful in a three-way or even two-way configuration, so I mounted it in a test cabinet with a 14” × 12” baffle (with foam damping material) and performed a series of on- and off-axis gate sine wave sweeps. This can be seen in the on-axis curve in Figure 10, along with the on- and off-axis SPL shown in Figure 11. The 3 dB down point at 30° with respect to the on-axis occurs at about 1.5 to 2 kHz, making it possible to use the Morel in a two-way configuration with a large ribbon or an AMT transducer. Figure 12 provides the two-sample SPL comparison, showing the Morel TiCW 1058Ft to be well matched within the relevant performance range.
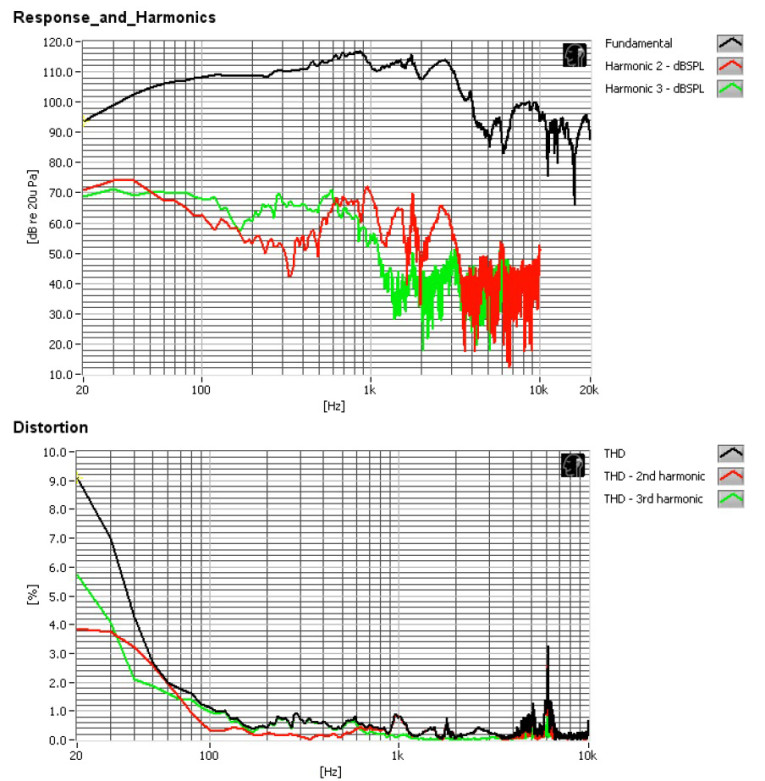
Next, I used the Listen SoundCheck analyzer to perform distortion analysis and time-domain analysis. For distortion measurements, I set the voltage level with the driver mounted in a free air and the voltage increased until the driver produced a 1 m SPL of 94 dB (7.4 V), which is my SPL standard for home audio driver distortion measurement. Then, I made the distortion measurement with the microphone placed 10 cm from the center point of the cone (see Figure 13). This actually includes two plots, the top graph being the standard fundamental SPL curve with the second and third harmonic curves, and the bottom graph the second and third harmonic curves plus the total harmonic distortion (THD) curve with an appropriate X-axis scale.
Interpreting the subjective value of conventional distortion curves is almost impossible. However, looking at the relationship of the second- to third-harmonic distortion curves is of value.
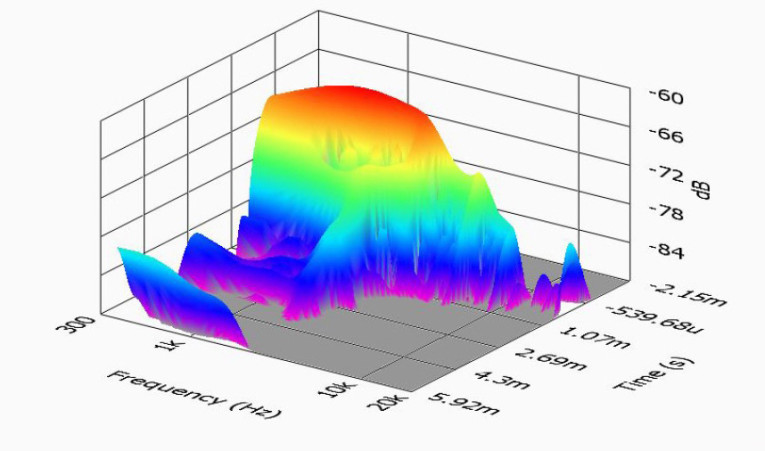
I then used SoundCheck to get a 2.83 V/1 m impulse response (again mounted in the enclosure with the 14” × 12” baffle) and imported the data into Listen’s SoundMap Time/Frequency software. Figure 14 shows the resulting cumulative spectral decay (CSD) waterfall plot. Figure 15 shows the Wigner-Ville plot (which I chose for its better low-frequency performance).
The Morel TiCW 1058Ft 10” subwoofer represents the pinnacle of Morel’s pole-less dual magnet transducer technology, and although rather unconventional, it is obviously highly effective. Add to that the high build quality that is exhibited by all of Morel’s OEM products, plus good performance in a compact enclosure, and you have a subwoofer certainly worth OEM consideration. For more information, visit www.morelhifi.com

This article was originally published in Voice Coil, September 2015.