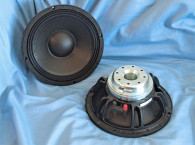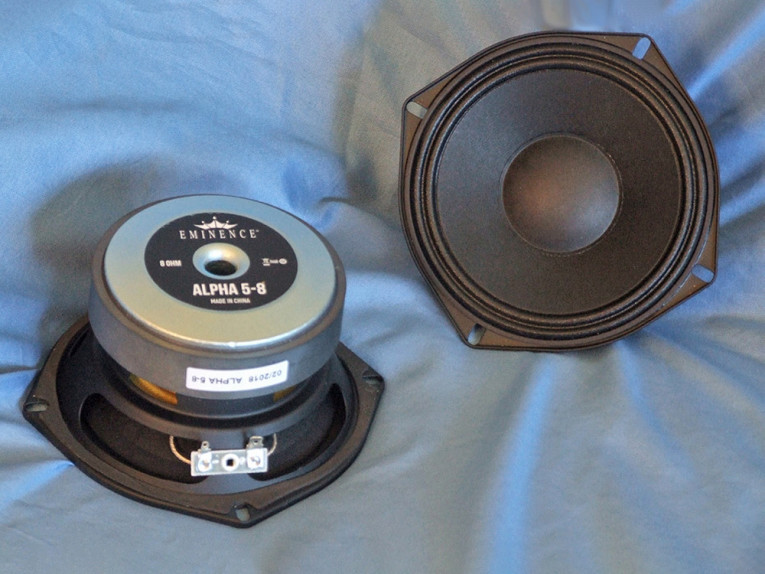
Features include a lightweight curved profile pulp paper cone with a water resistant coating, a 2” diameter solid composition paper dust cap (with a water resistant coating) and a stamped steel frame, plus a very robust (for a 5” driver) 125 W nominal power handling capacity. Cooling is provided by a 0.47” (12 mm) pole type vent, four 22 mm × 8 mm vents located below the spider mounting shelf, plus six 4 mm diameter former vent holes (see Photo 1). Compliance is controlled by a two-roll pleated coated cloth surround and a by a 3.25” diameter flat cloth spider.
The motor assembly is powered by a 100 mm diameter 20 mm thick ferrite ring magnet with a conventional steel front plate and shaped back plate. Driving the cone assembly is a voice coil that consists of a 38.1 mm (1.5”) diameter polyimide former wound with round aluminum wire. Voice coil tinsel lead wires terminate to a standard pair of solderable terminals.
I began testing with the driver clamped to a rigid test fixture in free-air and used a LinearX LMS analyzer and VIBox to produce voltage and admittance (current) curves at 0.3 V, 1 V, 3 V, 6 V, 10 V, and 15 V. The 15 V curves were close to making a useful curve fit, however, I discarded them. I used the remaining 10 10-Hz-to-20-kHz 550-point stepped sine wave curve pairs for each sample. They were post-processed and the voltage curves divided by the current curves creating five impedance curves. I applied the LMS phase calculation procedure to each of the impedance curves and imported them, along with the voltage curve for each sweep, into the LEAP 5 Enclosure Shop CAD program.
Since most Thiele-Small (T-S) data provided by OEM manufacturers is produced employing either a standard T-S model or the LinearX LEAP 4 TSL model, I additionally created a LEAP 4 TSL model using the 1 V free-air curves. Please note, that even though LinearX is no longer in business after the unfortunate passing of chief engineer Chris Strahm, LEAP 5 is still one of the best driver parameter generators ever devised in the loudspeaker engineering paradigm, and I will continue to use it until something that is as accurate at predicting high voltage excursion becomes available.
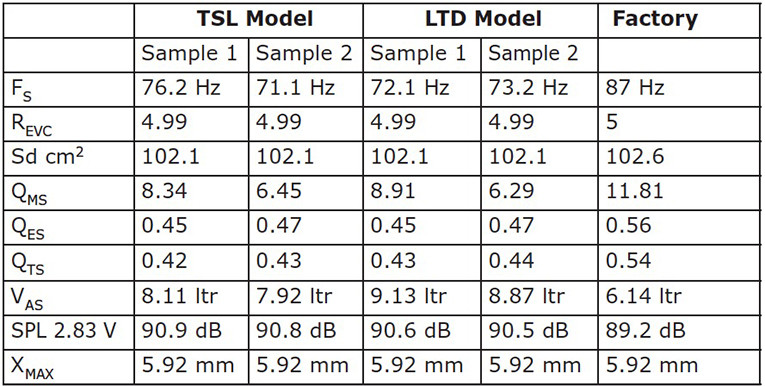
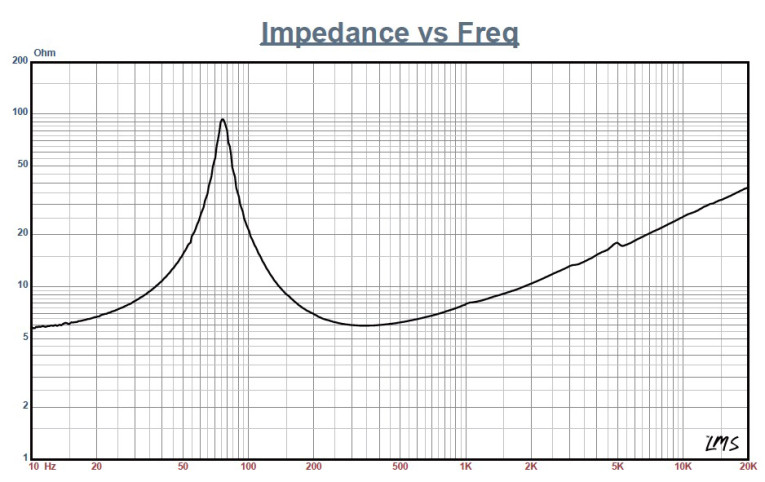
I selected the complete curve set, the multiple voltage impedance curves for the LTD model, and the 1 V impedance curves for the TSL model in the transducer derivation menu in LEAP 5 and created the parameters for the computer box simulations. Figure 1 shows the 1 V free-air impedance curve. Table 1 compares the LEAP 5 LTD and TSL data and factory parameters for both Alpha 5-8 samples.
T-S parameter results for Alpha 5-8 were close to the factory data, with some variance in the Vas and the sound pressure level (SPL). Please note that the SPL difference, which was rather small with this woofer, is due to two different calculation methods. The LEAP 5 SPL data is a calculated number that is intended to represent midband sensitivity. Eminence sensitivities are expressed as the average output across the usable frequency range when applying 1 W/1 m into the nominal impedance, (2.83 V/8 Ω, 4 V/16 Ω, etc.), which is perhaps a more accurate presentation of overall sensitivity of a driver than the calculated sensitivity method. The Qms/Qes numbers also appear to be different, but they have the same Fs/Qt ratio as the LEAP 5 calculated parameters and when I programmed the factory parameters into LEAP, the resulting simulation was identical to the simulation using the LEAP data.
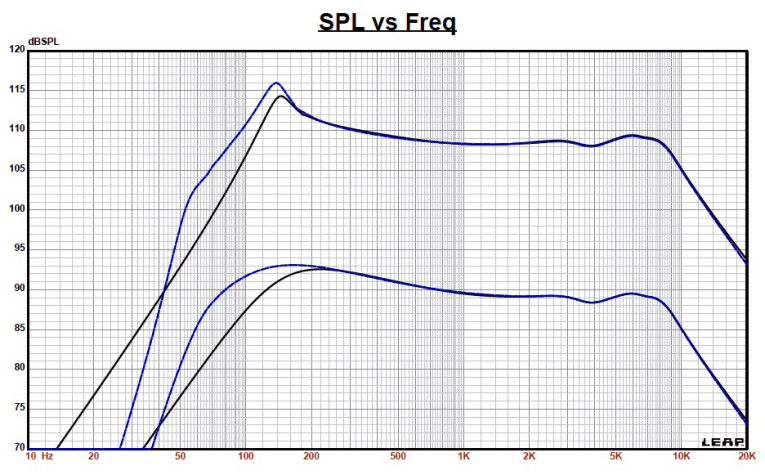
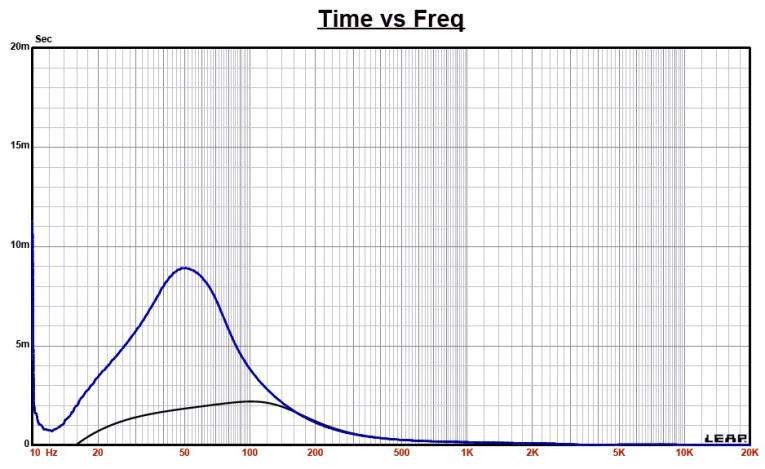
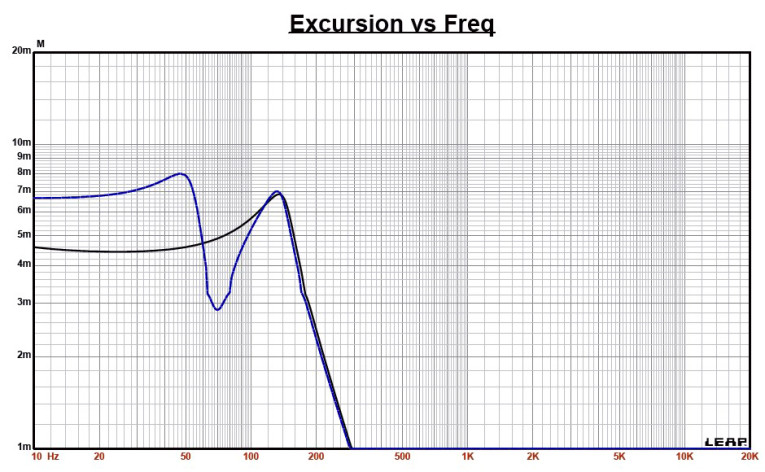
I programmed the computer enclosure simulations using the LEAP LTD parameters for Sample 1 with the recommended sealed and vented enclosure sizes and tuning listed for this driver on the Eminence website. This included a 0.16 ft3 closed box with 50% fiberglass fill material (suggested for midrange and array applications), and a 0.28 ft3 vented box alignment with 15% fiberglass fill material and tuned to 68 Hz. Figure 2 shows the results for the Alpha 5-8 in the sealed and vented boxes at 2.83 V and at a voltage level sufficiently high enough to increase cone excursion to Xmax + 15% (6.8 mm for the Alpha 5-8). This calculation resulted in a F3 frequency of 119 Hz with a Qtc = 0.69 for the 0.16 ft3 sealed enclosure and –3 dB = 68 Hz for the 0.28 ft3 vented box simulation. Increasing the voltage input to both simulations until the maximum linear cone excursion was reached resulted in 114.2 dB at 34 V for the smaller sealed enclosure and 116 dB with the same 34 V input level for the larger vented box. Figure 3 shows the 2.83 V group delay curves. Figure 4 shows the 34 V excursion curves.
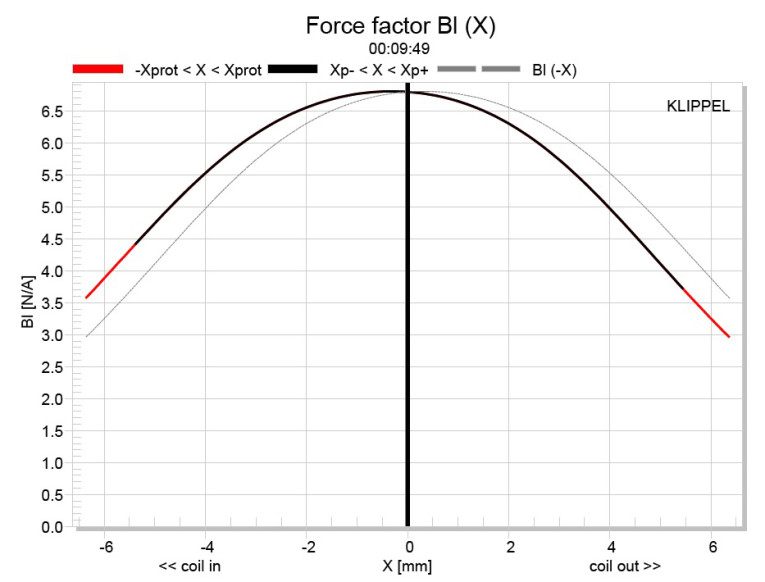
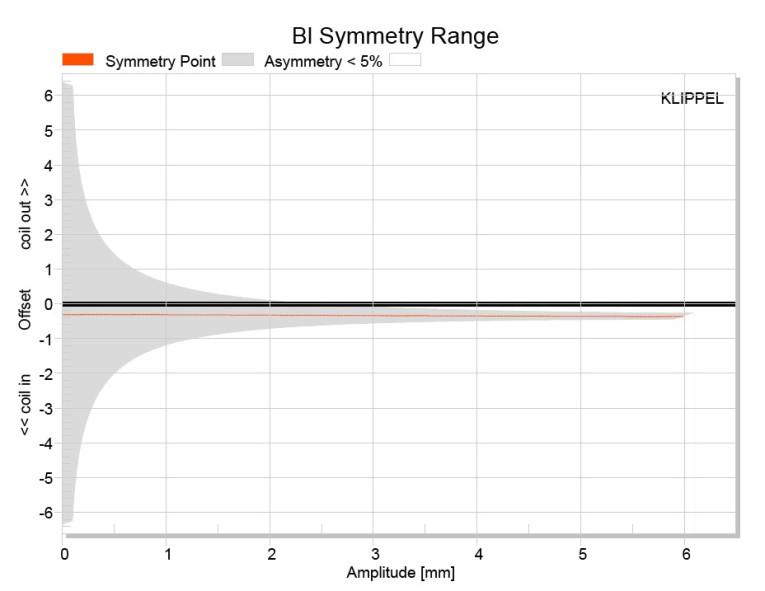

Klippel analysis for the Alpha 5-8 produced the Bl(X), Kms(X), and Bl and Kms symmetry range plots given in Figures 5-8. This month, since Patrick Turnmire was not available to perform the testing, the folks at Eminence graciously provided the data using their Klippel DA2 analyzer. The Bl(X) curve for the Alpha 5-8 (see Figure 5) is fairly narrow, but as you would expect for a short to moderate Xmax (5.92 mm) pro driver. However, the curve is reasonably symmetrical with a very small amount of coil-in offset. Looking at the Bl symmetry plot (see Figure 6), this curve is offset at a trivial 0.35 mm coil-in at the position of reasonable certainly (3 mm) and stays constant out past the driver’s physical Xmax, so maybe a slight rearward off-set of the voice coil position.
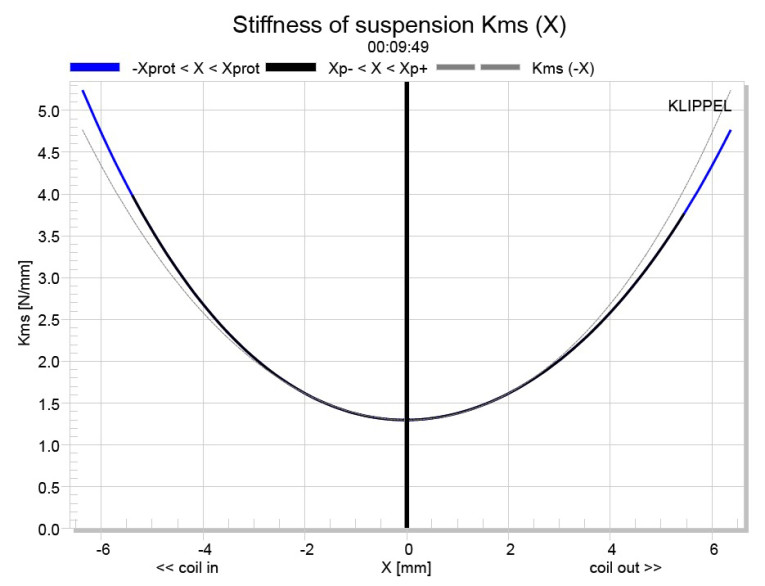
Figure 7 and Figure 8 give the Kms(X) and Kms symmetry range curves for the Alpha 5-8. The Kms(X) curve is very symmetrical with an extremely small amount of coil-out offset. Looking at the Kms symmetry range curve, there is 0.25 mm coil-out at the driver’s physical Xmax, so nearly perfect. Displacement limiting numbers calculated by the Klippel analyzer for the Alpha 5-8 were XBl at 82% Bl = 3.2 mm and for the crossover (XC) at 75%, Cms minimum was 2.3 mm. This means that for the Alpha 5-8, the compliance is the most limiting factor at the prescribed distortion level of 10%. Using the less conservative criteria of XBl at 70% and XC at 50%, the numbers are XBL = 4.3 mm and XC = 3.9 mm.
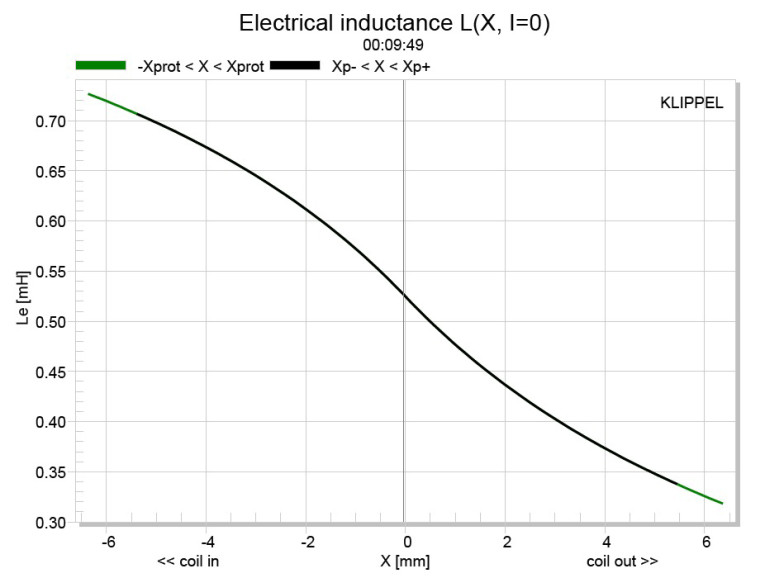

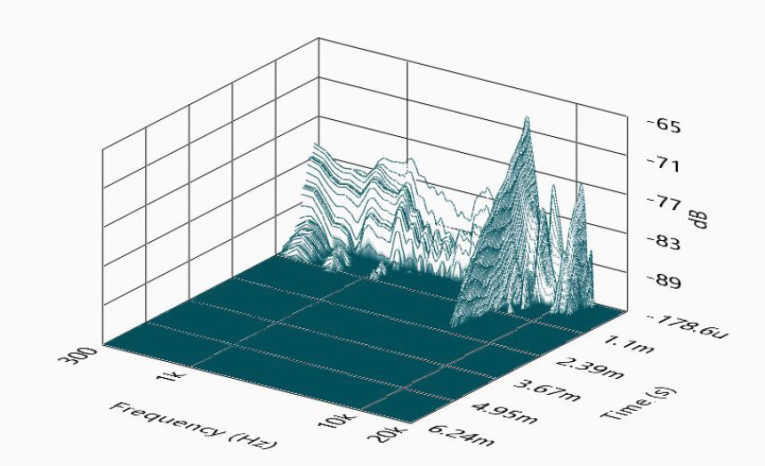
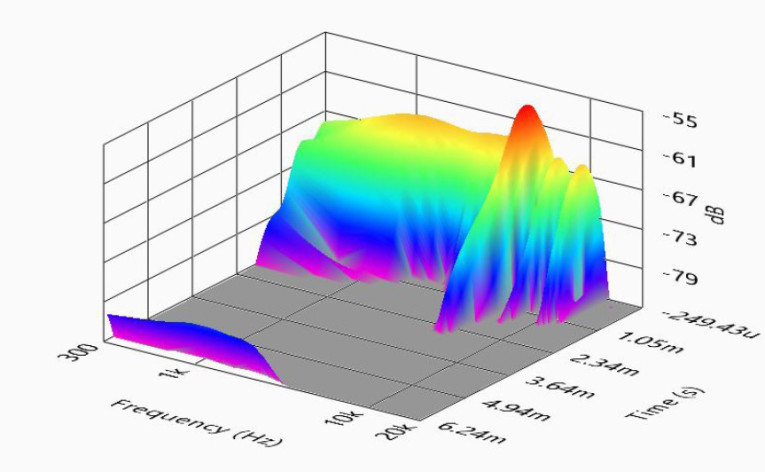
Figure 9 gives the inductance curves L(X) for the Alpha 5-8. Inductance will typically increase in the rear direction from the zero rest position as the voice coil covers more pole area, which is what you see in the inductance graph. From Xmax out to Xmax in, the inductance range is only 0.34 mH to 0.72 mH, which is only a 0.38 mH delta. This could be an even smaller variation with the addition of a shorting ring. Next, I fired up the Listen, Inc. SoundCheck analyzer (using SoundCheck 16 software and the AudioConnect interface along with the ¼” SCM measurement microphone) and set it up for distortion measurements. I mounted the Alpha 5-8 in free-air and set the SPL to 104 dB (5.21 V determined by using a noise stimulus) at 1 m, which is my standard for pro sound devices. The Alpha 5-8 produced the distortion curves shown in Figure 10. Following the distortion measurements, I mounted the Alpha 5-8 in an enclosure with a 12” × 8” baffle and made the impulse measurement. This was imported into Listen’s SoundMap software, windowed to remove the room reflections and produced the cumulative spectral decay (CSD) waterfall plot shown in Figure 11 and the Wigner-Ville plot shown in Figure 12.
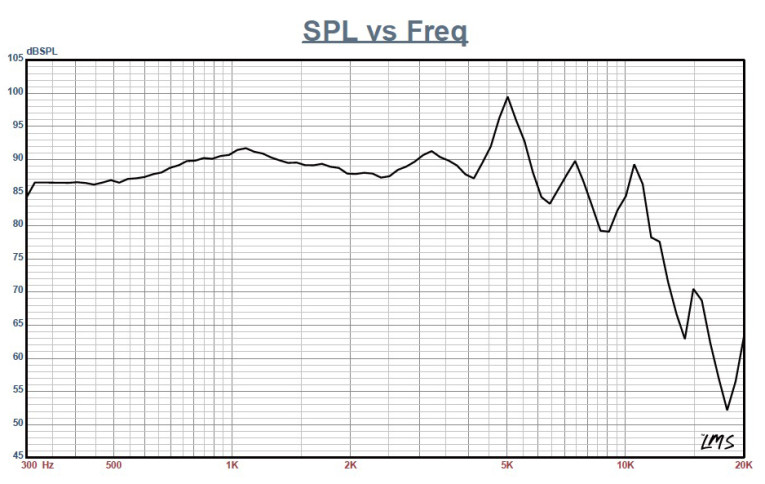
For the remaining series of SPL measurements, I used the same enclosure as was used with the impulse response. I then used the LinearX LMS analyzer to measure the driver frequency response both on and off axis from 300 Hz to 20 kHz with a 100-point resolution at 2.83 V/1 m, using a gated sine wave method. Figure 13 depicts the Alpha 5-8’s on-axis response, yielding a relatively smooth rising ±2.6 dB response out to 4.2 kHz followed by a three breakup mode peaks centered on 5 kHz, 7.5 kHz, and 10.5 kHz.
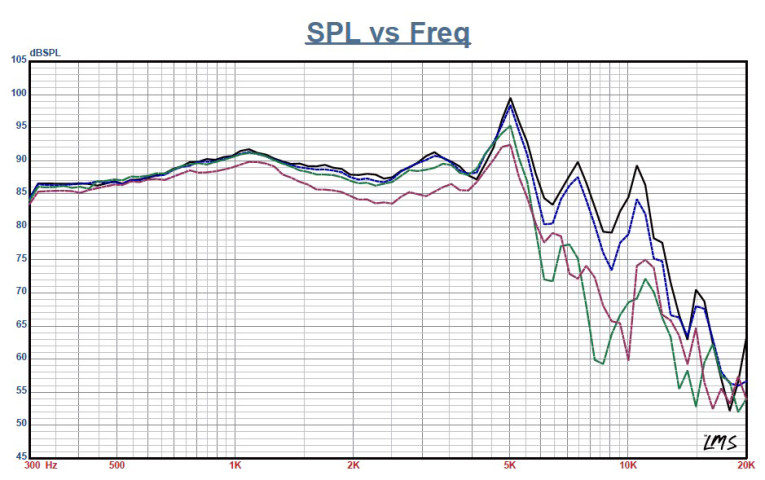
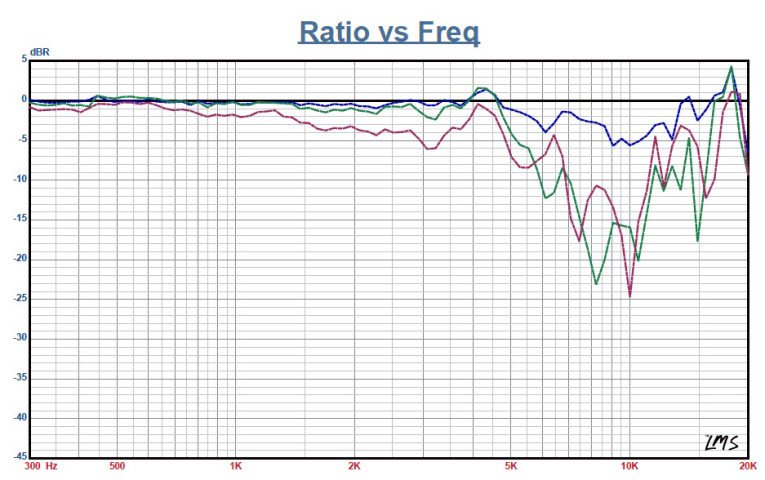
Figure 14 shows the off-axis frequency response at 0°, 15°, 30°, and 45°. The -3 dB at 30° with respect to the on-axis curve occurs at above 4 kHz, which is in the vicinity of the typical 3.5 kHz to 4.5 kHz frequently used for 5” drivers with 1” domes (with a horn, anywhere lower than that is appropriate). Figure 15 gives the normalized version of Figure 14.
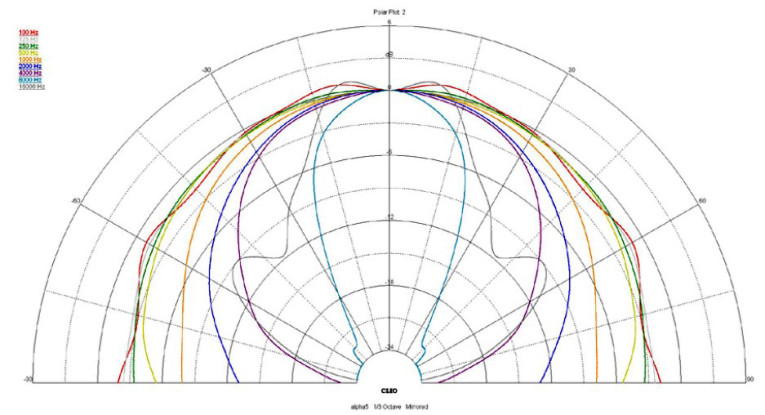
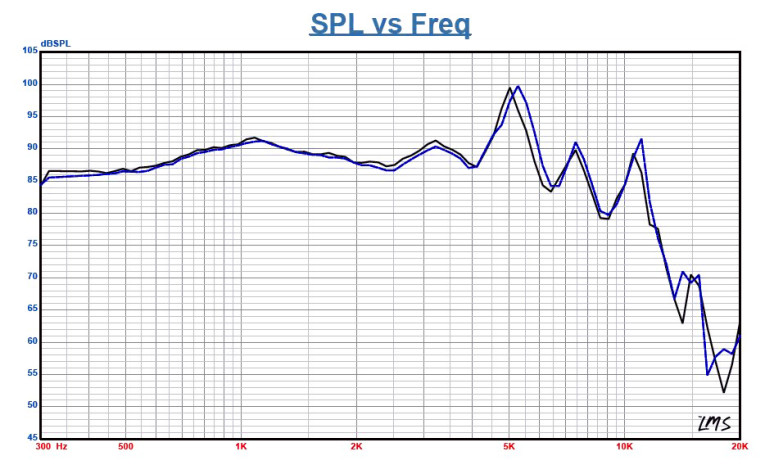
Figure 16 shows the CLIO Pocket-generated horizontal plane polar plot (in 10° increments with 1/3 octave smoothing applied). And last, Figure 17 gives the two-sample SPL comparisons for the Alpha 5-8 driver, showing both samples very closely matched throughout the operating range of the driver. As is always the case, the Alpha 5-8 represents another well-crafted and well-thought-out product from Eminence. For more information about Eminence Pro Sound drivers, visit www.eminence.com. VC
This article was originally published in Voice Coil, August 2018.