Designing The Crossover
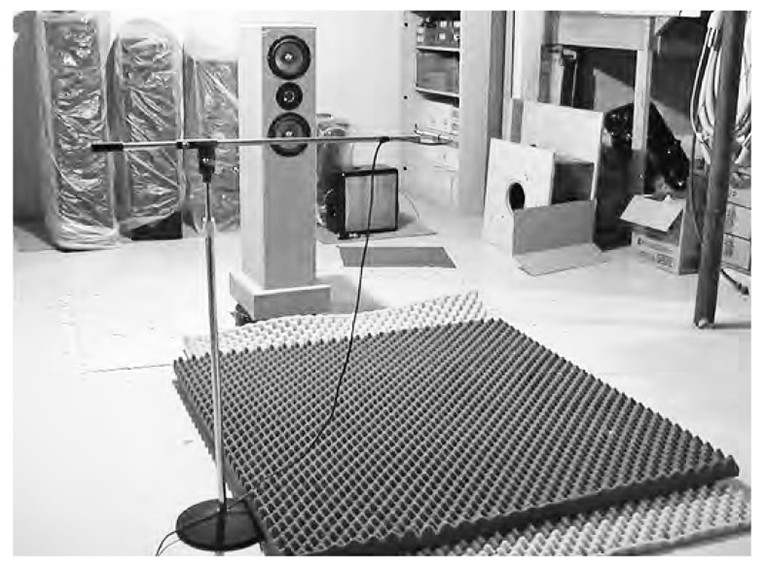
With the line optimally damped, my efforts now turned to the design of the crossover. Crossover design for me is a three-step process. First, I placed all drivers in the prototype enclosure of Fig. 1A and made acoustic and electrical measurements on them. The measurements include acoustic frequency and phase response, acoustic phase center and electrical impedance. This process is described in detail in Chapter 7 of reference [5].
I then enter this data into one of the many crossover optimization programs I have to develop a preliminary crossover design. Lest you think that this process is automatic and that the software does all the work, be warned that these optimization programs are quite dumb. They cannot decide on an optimum crossover topology and they do not know which components should be optimized and which should be left alone. This is where the “art” of crossover design with optimization software comes in. The software saves many hours of experimentation, producing a preliminary design that gets you quickly into the ballpark, but the designer must pick the right crossover topology and guide the optimization process to a reasonable result.
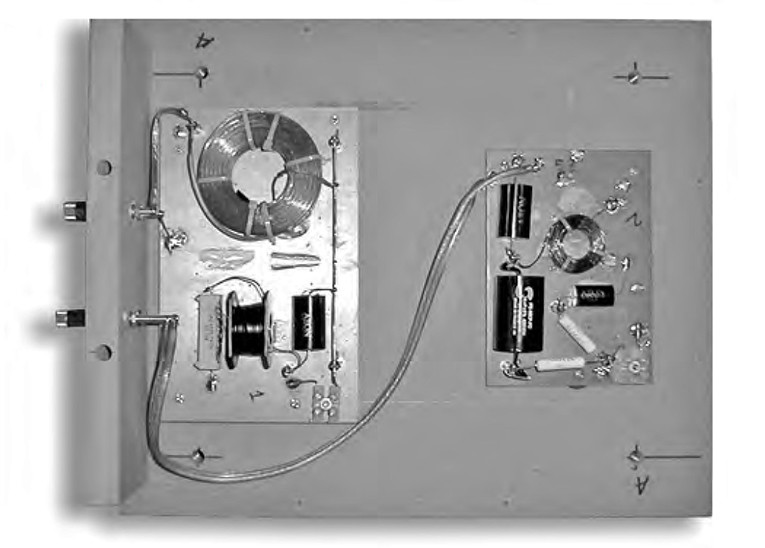
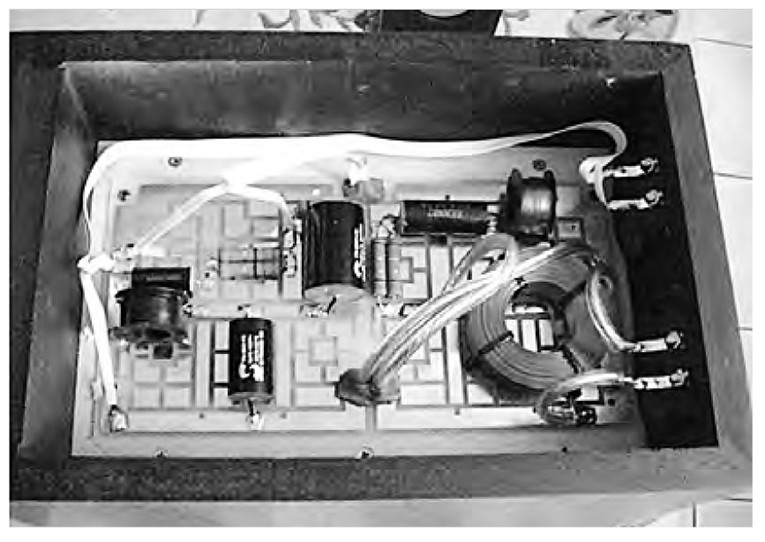
Photo 2: Prototype crossover.
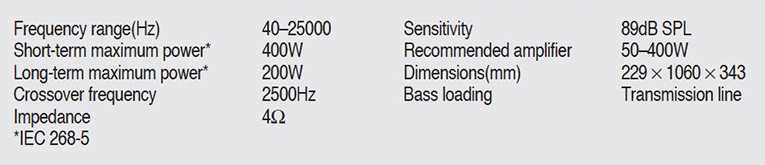
Table 4: THOR System Specifications
In the last step I built the preliminary crossover and auditioned it extensively, and used these listening tests for the final tailoring of loudspeaker performance.
Crossover Design Criteria
In designing a crossover I have two primary requirements: 1) flat on-axis first arrival response and 2) uniform horizontal polar response. Directional cues so important to imaging are determined primarily by a loudspeaker’s first arrival response, which should be relatively flat to avoid amplitude distortion of the directional information.
However, the overall frequency balance of a loudspeaker as perceived by a human listener is a combination of direct and reflected sound. Off-axis energy arrives at the listening position after reflection off the walls. In typical listening rooms this energy arrives well within the Haas fusion zone, a time interval starting just after the first arrival and extending out to 40–50ms. Even if the on-axis response is flat, poor off-axis response can produce a perceived colored frequency balance.
For good stereo imaging and proper spectral balance from side-wall reflections, the horizontal polar response off-axis curves should be smooth replicas of the on-axis response with an allowable exception for the natural rolloff of the tweeter at higher frequencies and larger off-axis angles. (Our ear-brain combination tends to reject higher-frequency side-wall reflections.) There are several other important quantitative measures of speaker performance, but these are not controlled directly by the crossover network. See my many loudspeaker test reviews in audioXpress for a complete discussion of these other measures.
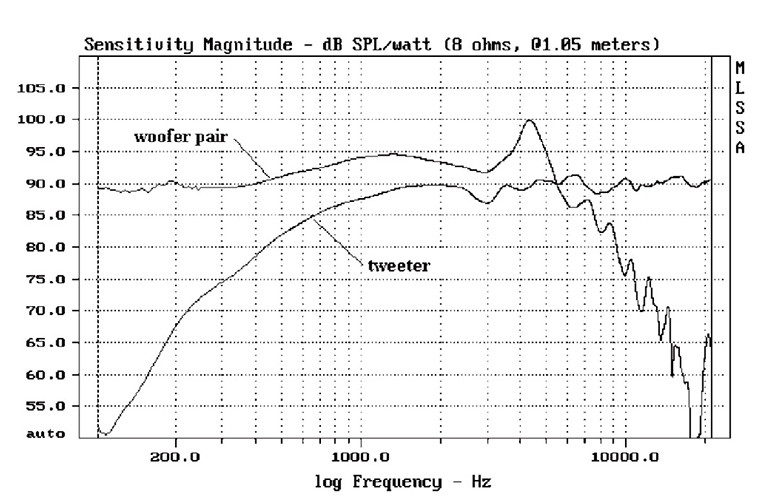
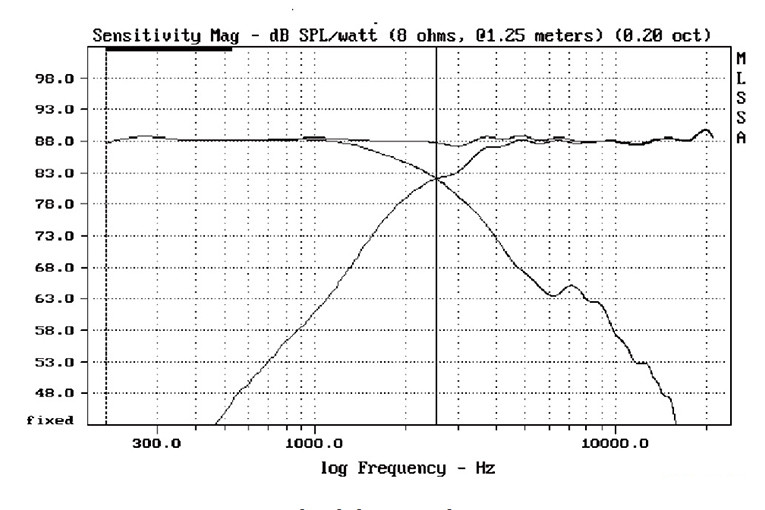
Figure 9: Woofer pair and tweeter frequency responses above 100Hz.
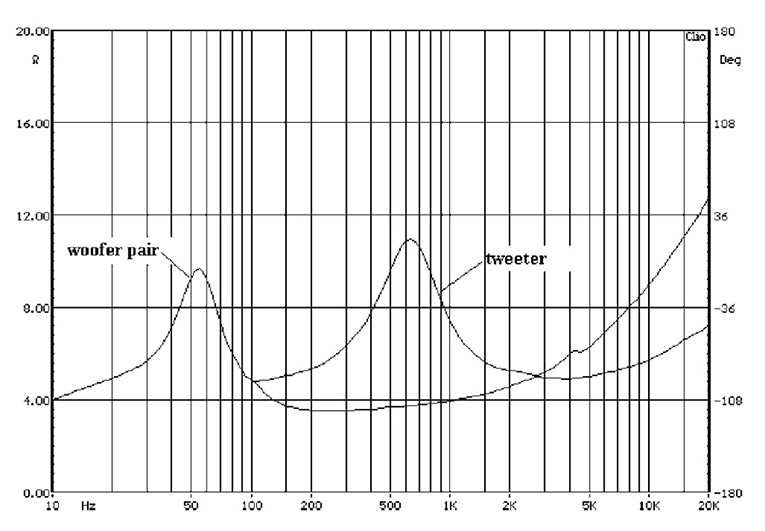
Figure 10: Woofer pair and tweeter impedance.
Individual Driver Testing
Figure 9 shows the quasi-anechoic frequency response (first arrival response) of the woofer pair and tweeter with the microphone placed on the tweeter axis at a distance of 1.25m. The plot scale covers 100Hz to 20kHz. The data is then normalized to 1m to get driver sensitivity. (Woofer pair response below 100Hz is determined via near-field techniques previously discussed.)
Tweeter response averages 90dB SPL/1m/2.83V above 2kHz. Below 2kHz tweeter response falls off smoothly with a slightly over-damped response. Starting at about 1500Hz the woofer pair response falls 5dB with decreasing frequency, reaching a uniform level of about 90dB at and below 400Hz. The fall-off is due to the spreading loss characteristic of all woofers on narrow baffles ([5], Chapter 4). The woofer peaks to 100dB at 4.4kHz and then falls off at an average rate of 24dB/octave one octave above that frequency.
Frequency responses of the woofer pair and tweeter overlap between 1.2kHz and 5kHz, suggesting that a preliminary value of 2.5kHz for the crossover frequency would be a good place to start design. This frequency may be subject to change depending upon the resulting horizontal polar response. Woofer pair and tweeter impedances are plotted in Fig. 10. The woofer pair impedance of Fig. 7 has been extended out to 20kHz.
Photo 3: Prototype TL.
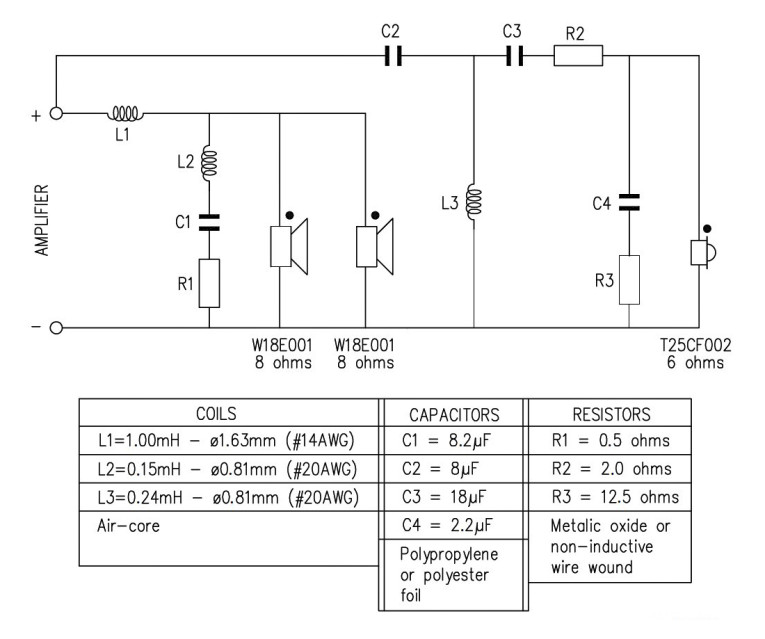
Figure 11A: Crossover network for THOR and ODIN Mk3.
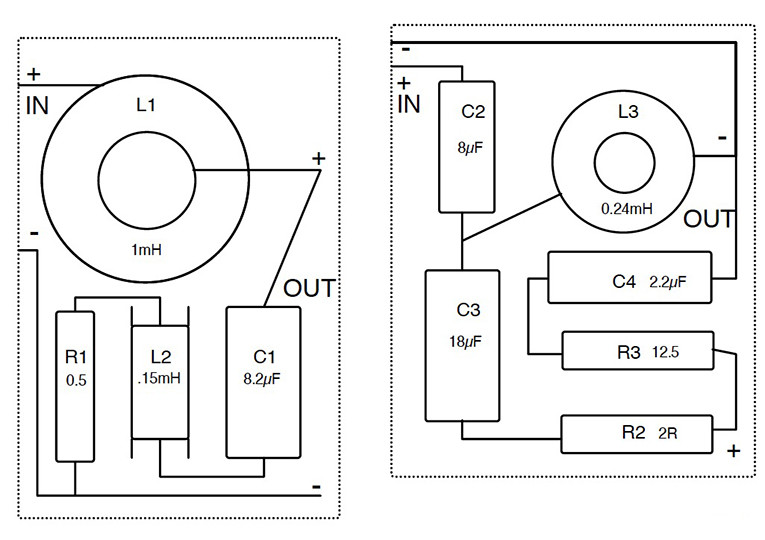
Figure 11B: Crossover layouts.
Crossover Topology Selection And Optimization
I favor in-phase, i.e., even-order, crossovers for most applications because they are the least sensitive to inter-driver phase differences and timing errors. In the case of the MTM configuration they also limit off-axis response in the vertical which greatly reduces floor and ceiling reflections. For the THOR TL the goal was to design a fourth-order acoustic crossover response at a crossover frequency of 2500Hz.
The woofer crossover must accomplish three functions: 1) control the response rise between 400Hz and 1.5kHz, 2) suppress the 100dB woofer peak at 4.4kHz, and 3) provide the final high-frequency rolloff, which, when combined with the woofer’s natural response, produces the desired 24dB/octave acoustic decay.
To adequately protect the tweeter the electrical rolloff of the tweeter crossover must be at least 12dB/octave at all frequencies below crossover. The tweeter’s acoustic rolloff below 1kHz begins at a rate of 6dB/octave and transitions to 12dB/octave below 300Hz. The tweeter crossover must therefore produce an electrical attenuation starting at 18dB/octave and then transition 12dB/octave to attain the desired overall 24dB/octave acoustic rolloff.
With these points in mind the crossover circuit topologies I finally selected are shown in Fig. 11. Look at the woofer pair crossover first. There is a tendency in crossover design to separate the basic crossover action from the specialized functions of spreading loss correction and response peak suppression.
There is also an often-unthinking use of Zobel impedance compensation when better performance is often obtained without one. This leads to overly complex crossovers. The woofer crossover topology I finally settled on combines the three required functions with an economy of parts and results in absolutely astounding and seamless driver integration.
Woofer and tweeter crossover voltage transfer functions after optimization are shown in Fig. 12. For those of you with some circuit theory background, the woofer crossover is a third order electrical filter with a second order zero. The woofer crossover voltage response is explained as follows. L1 provides an initial rolloff of 6dB/octave starting at 400Hz to compensate for rising response of the woofer pair. The R1, C1, L2 triple forms a series resonant shunt that comes into play around 2500Hz. It produces a 31dB notch at the woofer peak and provides additional high-frequency rolloff. Resistor R1 controls the depth of the notch. Finally, beyond 10kHz the woofer crossover response flattens out, but that is OK because the woofers are falling off at 24dB/octave above the notch.
With a Zobel, the woofer crossover response would continue to fall off above 10kHz at a 6dB/octave rate. Without a Zobel, however, the rising impedance of L1 is matched by the rising impedance of the woofer pair voice coils, resulting in no net electrical rolloff. Figure 12 also shows the 18dB/octave rolloff required by the tweeter below 1kHz. The tweeter crossover output is down 36dB at 600Hz, the tweeter’s measured resonant frequency. The transition to 12dB/octave occurs below the scale of the plot.
Crossover parts values are also listed in Fig. 11A. It is very important to use the specified coil wire size for L3. Below 300Hz L3 coil resistance dominates over coil inductive reactance so that the crossover looks like a double RC filter filter giving the required 12dB/octave attenuation. A larger wire size would reduce coil resistance and push the transition frequency down to a lower value. Resist the urge to use a larger wire size. Photo 2 shows the prototype crossover.
Figure 12: Crossover voltage responses.
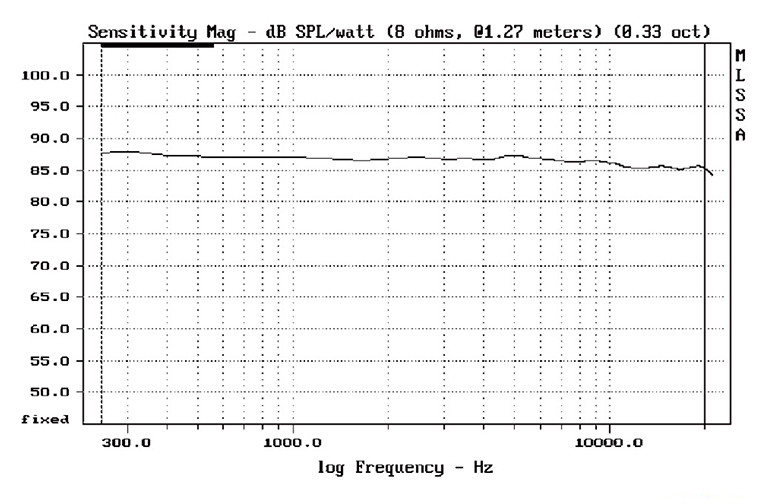
Figure 13: Full-range on-axis frequency response.
Figure 14: System and individual driver responses.
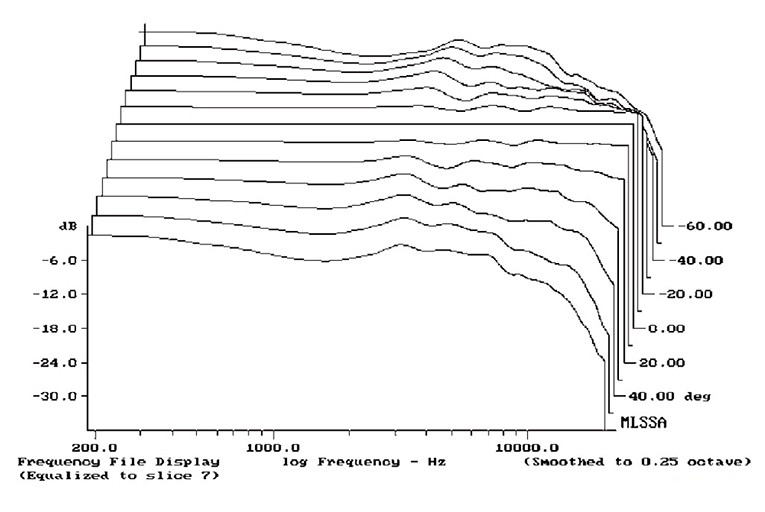
Figure 15: Horizontal polar response.
Figure 16: THOR average horizontal response over ±30°.
Frequency And Polar Response Test Results
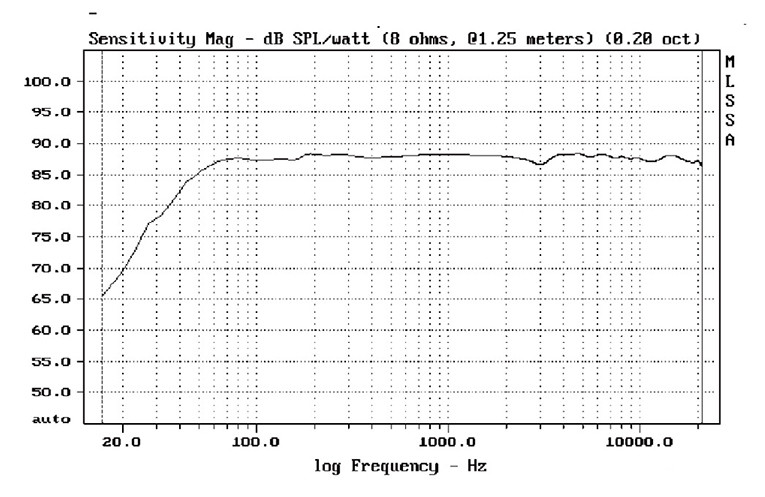
Photo 3 shows the prototype TL ready for testing in my lab. Figure 13 shows the full-range quasi-anechoic frequency response obtained with the microphone placed on the tweeter axis at a distance of 1.25m. Response is flat within ±1dB from 200Hz to 20kHz. Low-frequency f3 is 44Hz. Sensitivity averages 88dB SPL/1m/2.83V.
Figure 14 shows system frequency response and response of the individual drivers on an expanded frequency scale. On this plot the crossover frequency is highlighted at 2526Hz, satisfyingly close to the target crossover of 2500Hz. Horizontal polar response is examined in Figs. 15 and 16. Figure 15 is a waterfall plot of horizontal polar response in 10° increments from 60° right (−60°) to 60° left (+60°) when facing the speaker. All off-axis plots are referenced to the on-axis response, which appears as a straight line at 0.00°. Thus, the plotted curves show the change in response as you move off-axis.
For good stereo imaging the off-axis curves should be smooth replicas of the on-axis response with the possible exception of some tweeter rolloff at higher frequencies and larger off-axis angles. For home theater applications a more restricted high-frequency response may be desirable. From Fig. 15 you find that the −3dB beam width at crossover is ±50°. There is a bit more off-axis droop around 1500Hz, but the −3dB beam width is still ±45°.
Above 15kHz and at angles greater than 40° there is a fairly steep fall-off in response that is characteristic of 28mm tweeters with a recessed dome. But, as I indicated earlier, this performance is perfectly acceptable. The −3dB beam width at 15kHz is still ±25°. The average horizontal frequency response over a 60° arc is a good measure of perceived frequency response. This average response is plotted in Fig. 16. Relative to 1kHz, response at 10kHz is down only 0.9dB. At 20kHz the figure is 1.4dB. This plot, in particular, shows THOR’s excellent in-room frequency balance.
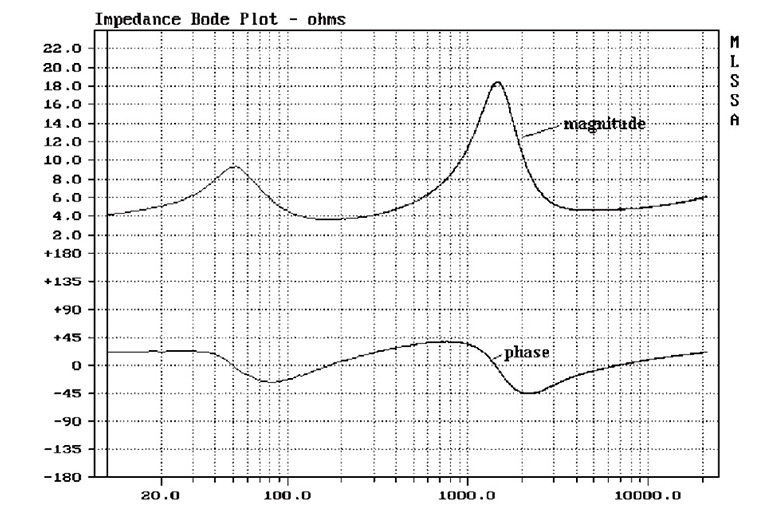
THOR’s impedance magnitude and phase are plotted in Fig. 17. The minimum impedance of 3.6Ω occurs at 180Hz. The impedance peak of 18.3Ω at 1.5kHz is caused by the interaction of the woofer and tweeter crossover networks forming a parallel resonance at that frequency. The maximum phase angle of 45° occurs at 2140Hz, but the impedance magnitude at that point is 10Ω. The system impedance is rated at 4Ω.
Figure 17: THOR impedance magnitude and phase.
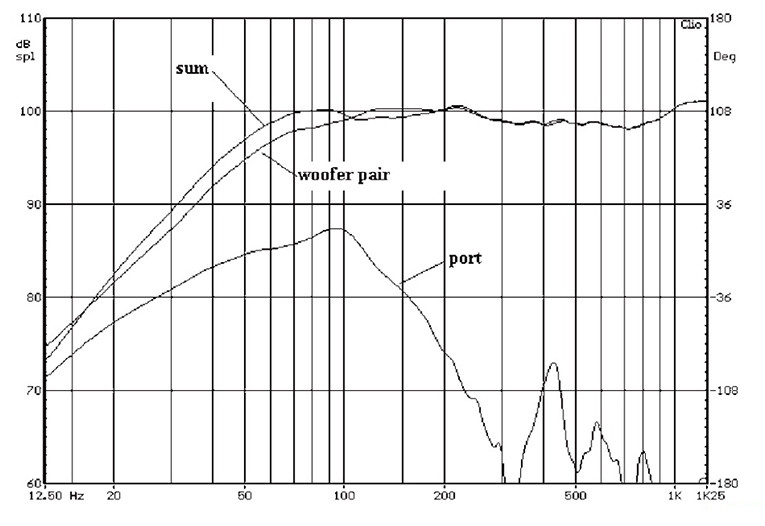
Figure 18: TLine responses: 13 oz front and 7 oz batting.
Practical Considerations
After many months of operation, the Dacron pillow filler settled in the second half (the rising part) of one of the lines. This occurs only in the second half of the line because it expands toward the bottom of the enclosure giving little support to the filling material. The settling did not appear to affect performance, but the problem can be avoided altogether by using either Acousta Stuf (available from Mahogany Sound) or Dacron Quilt padding in the second half of the line. Performance will be the same with either solution.
In the case of Acousta Stuf you will need 21 oz of material divided into 13 oz for the first half and 8 oz for the second half of the line. This material must be thoroughly teased out to fill each volume. Alternatively, you can fill the second half of the line with Dacron Quilt padding, which will retain its shape when placed in the line. You will need about 9 oz of the material. Cut it into three 7.5″ wide strips.
The first strip should equal the length of the last half of the line. The second and third strips should be two thirds and one-third the length of the first, respectively. The longest strip fill the second half of the line, while the second and third strips fill two-thirds and one-third of the lower portions of the line, respectively. Low-frequency response using the quilt padding is shown in Fig. 18.
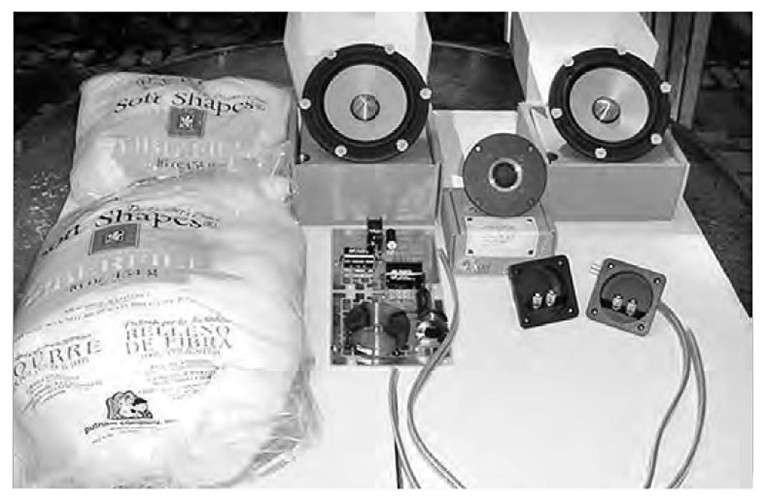
Photo 4: Parts kit from Madisound.
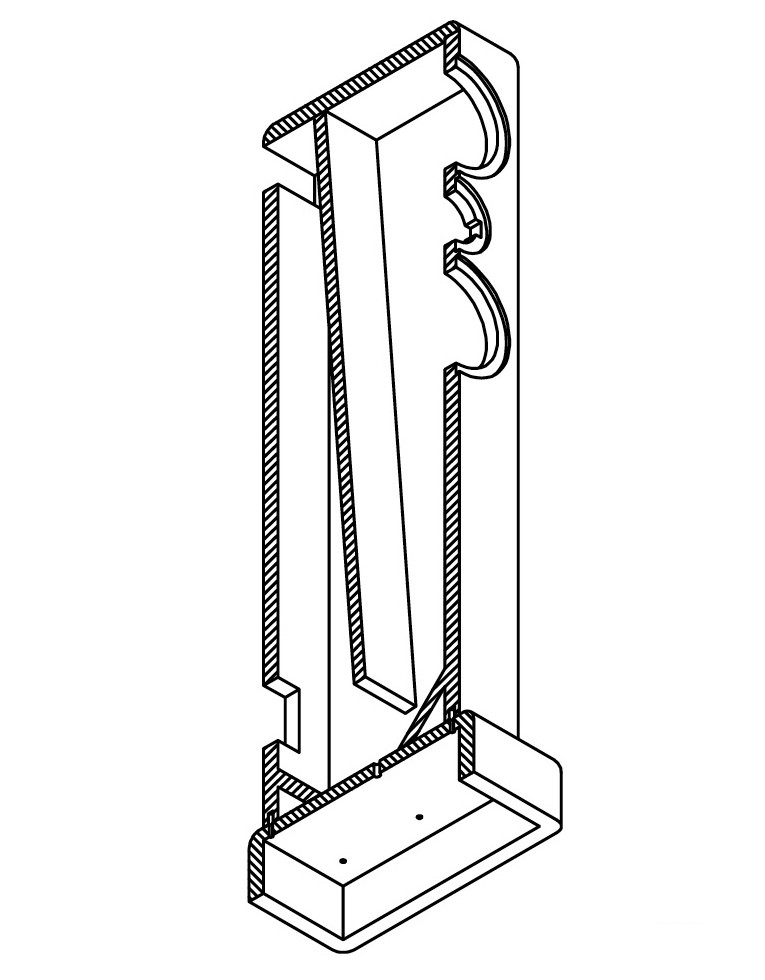
Figure 19: Enclosure plans.
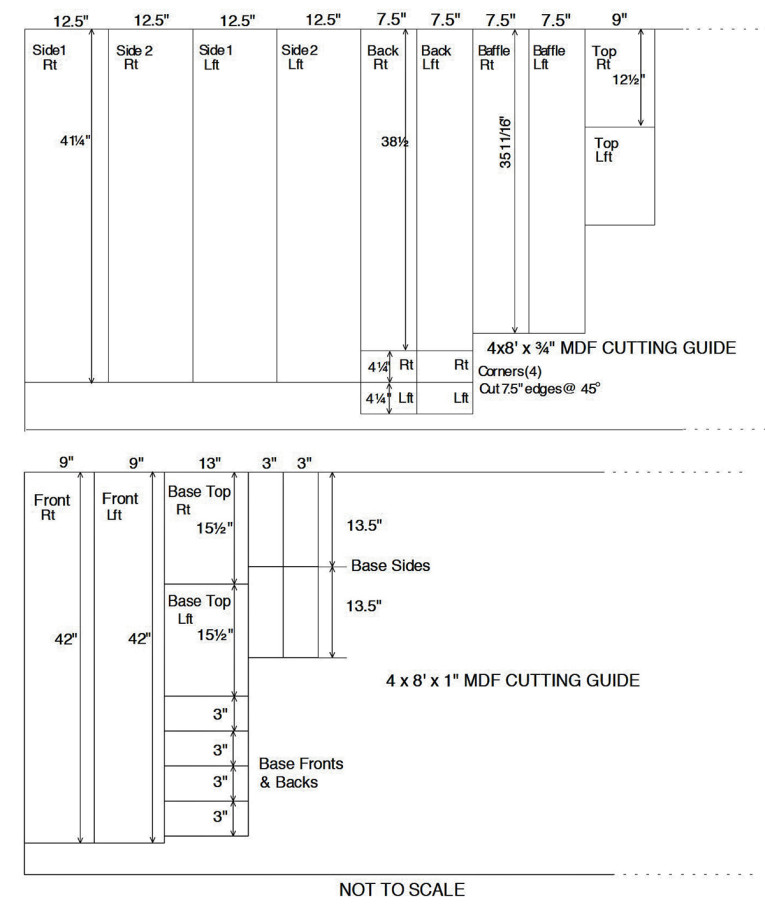
Figure 20: Cutting guide.
Construction
I will not give detailed instructions for building the THOR enclosure. Enclosure plans are given at the end of this article (Fig. 19) and also are available on the SEAS website at www.seas.no.
Photo 5: An enclosure version from Madisound.
We have provided a cutting guide (Fig. 20) that also specifies the total amount of material needed for each enclosure. Any experienced woodworker should be able to follow the plans without difficulty For those of you who do not care to build the cabinets from scratch, enclosures are available from the sources listed at the end of the article. A complete kit of parts including drivers and crossovers is also available from these sources. Photo 4 shows the parts kit provided by Madisound. One version of the enclosure also available from Madisound is shown in Photo 5, filled and ready for driver installation. Photo 6 shows a finished crossover mounted in the base of the enclosure.
Summary
In this article you have seen that Augspurger’s work represents an excellent starting point for the design of transmission-line loudspeakers. His recommendations on packing density versus line length are right on target. Once a prototype line is built, the optimum packing density is easily determined experimentally with a sequence of acoustic and/or electrical impedance measurements. Similar acoustic and impedance measurements on the drivers mounted in the prototype enclosure then provide the data for rapid CAD design of a trial crossover network.
References
1. G. L. Augspurger, “Loudspeakers in Damped Pipes—Part One: Modeling and Testing; and Part Two: Behavior,” 107th JAES Convention, 24–27 September, 1999, Preprint No. 5011.
2. G. L. Augspurger, “Transmission Lines Updated, Part 1,” SB 2/00.
3. G. L. Augspurger, “Transmission Lines Updated, Part 2,” SB 3/00.
4. G. L. Augspurger, “Transmission Lines Updated, Part 3,” SB 4/00.
5. J. A. D’Appolito, Testing Loudspeakers, Audio Amateur Corporation, Peterborough, NH, 1998.
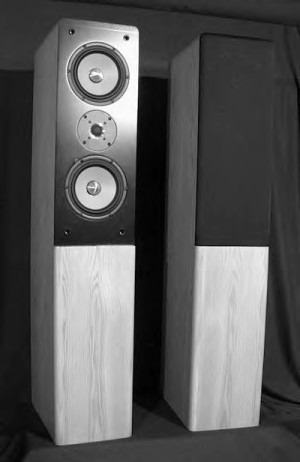
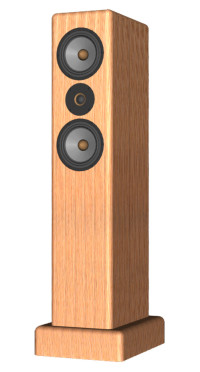
THOR is a top-of-the-line loudspeaker kit from SEAS. It is a full range, floor-standing system that provides the very highest level of acoustic performance. This kit uses two W18E001 woofers and a single T25CF002 “Millenium” tweeter mounted in a D'Appolito configuration.
The enclosure uses a newly developed transmission line configuration, derived both from sophisticated computer modeling, and extensive experimentation. The line is tapered, and filled with Dacron stuffing. The two W18E001 woofers excite the line at slightly different points, smoothing the response and increasing the range of bass output.
The transmission line produces 4 dB of bass lift from 20Hz to 110HZ, with less than 1 dB of ripple. The -3dB point is 45Hz, with roll off of 12dB per octave below 45Hz. Usable in-room bass response extends well into the low 30Hz range.
The crossover network is conventional except for a parallel circuit which suppresses the response peak due to the magnesium cone. The crossover frequency is 2.5kHz.
Thor is sure to impress discriminating listeners. The highs are transparent. The midrange has exceptional clarity and openness. The bass is deep and solid. The cabinets are assembled Oak veneer with solid Oak corners, in a Clear or Black finish. The grills are black and are recessed flush with the speaker front. See more about the THOR Kit on the SEAS website.


 About the SEAS Thor Kit