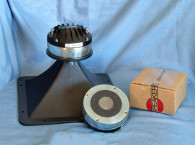
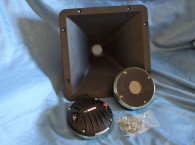
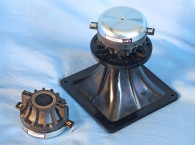
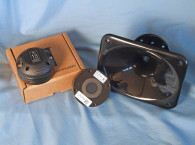
The DE1085TN has a 50 mm (2”) throat diameter and is driven by a titanium diaphragm with a 100 mm (4”) diameter voice coil wound with copper-clad aluminum wire (CCAW). Other features include a neodymium ring magnet motor structure, nominal 140-W rated power handling (240 W continuous), an injection-molded aluminum black heatsink, and color-coded chrome push terminals. The horn supplied with the DE1085TN is B&C Speakers’ 2.0” throat 60 H × 40 V constant directivity cast-aluminum ME60 horn with a 0.8-kHz cutoff frequency.
I used the LinearX LMS analyzer to produce the 300-point stepped sine wave impedance plot shown in Figure 1. The solid black curve represents the DE1085TN mounted on the ME60 horn and the dashed blue curve represents the compression driver without the horn. With a 5.97 Ω direct current resistance (DCR), the DE1085TN/ME60’s minimum impedance was 7.89 Ω and at 4.8 kHz.
I free-air mounted the DE1085TN/ME60 without an enclosure and used a 100-point gated sine wave sweep from 0° on-axis to 60° off-axis to measure the horizontal and vertical on and off axis at 2.83 V/1 m. Figure 2 shows the on-axis frequency response, which is smooth with no major anomalies from ±3 dB from 1 to 5 kHz . However, it has a declining response as frequency increases above 5 kHz, down 7.6 dB at 10 kHz (with respect to 5 kHz). B&C Speakers’ recommended crossover frequency is 800 Hz with a second-order or higher high-pass filter.
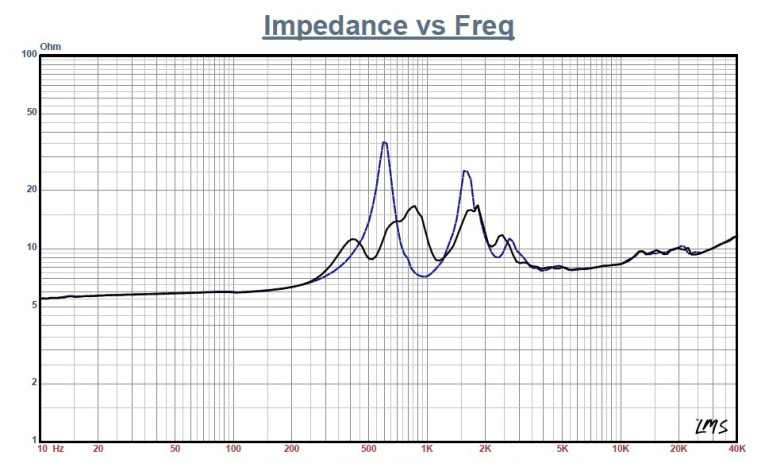
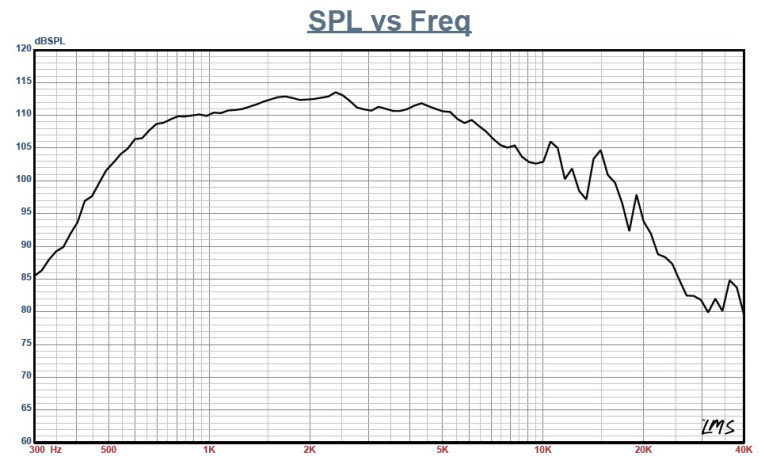
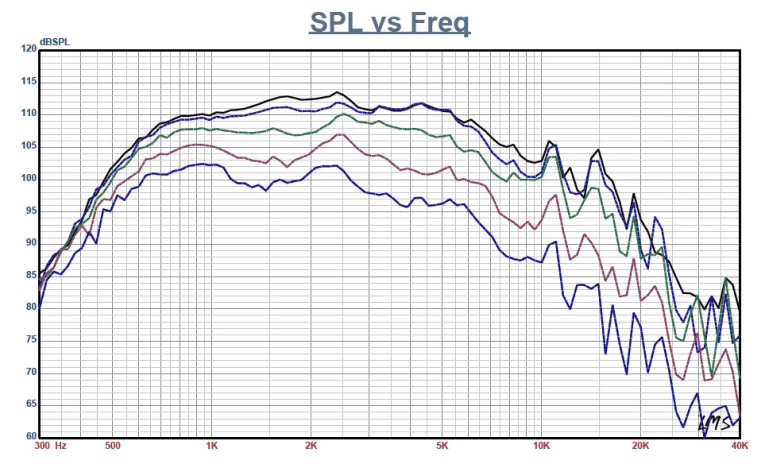
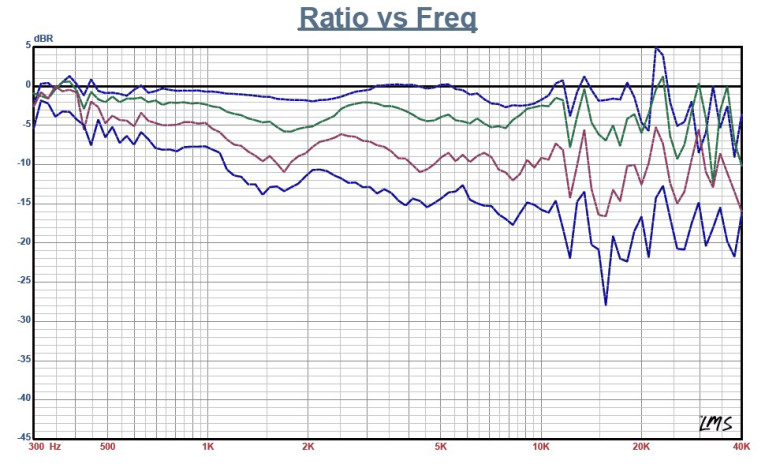
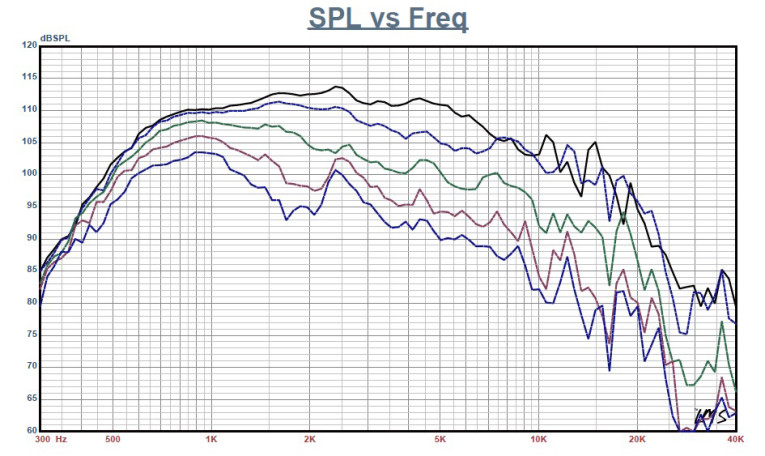
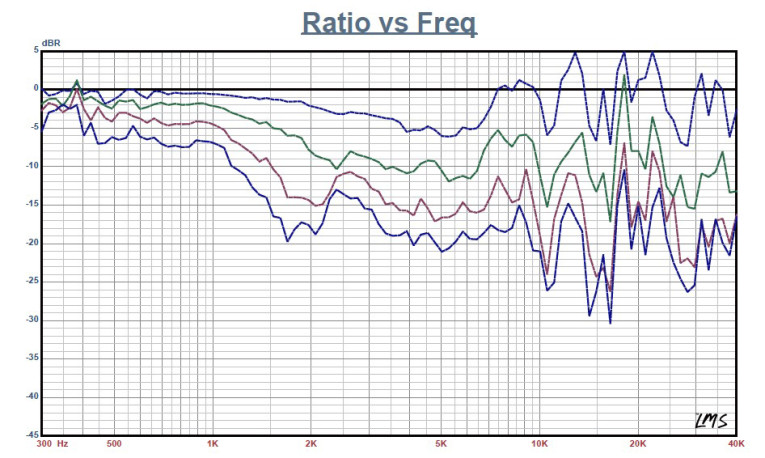
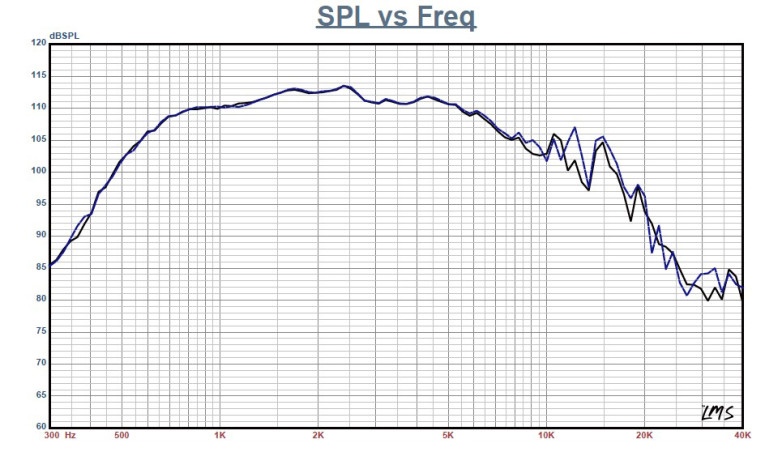
Figure 3 shows the on- and off-axis response in the horizontal plane. Figure 4 shows the normalized horizontal plane response. Figure 5 gives the on- and off-axis response in the vertical plane. Figure 6 shows the normalized vertical plane response. Last, Figure 7 is the two-sample SPL comparison showing the two DE110 samples to be closely matched.
Next, I again fired up the Listen AmpConnect ISC analyzer, the 0.25” SCM microphone, and the power supply to measure distortion and generate time frequency plots. I should note that this is the first Test Bench that we are using the lastest version of SoundCheck with the company’s new logo, SoundCheck 14.
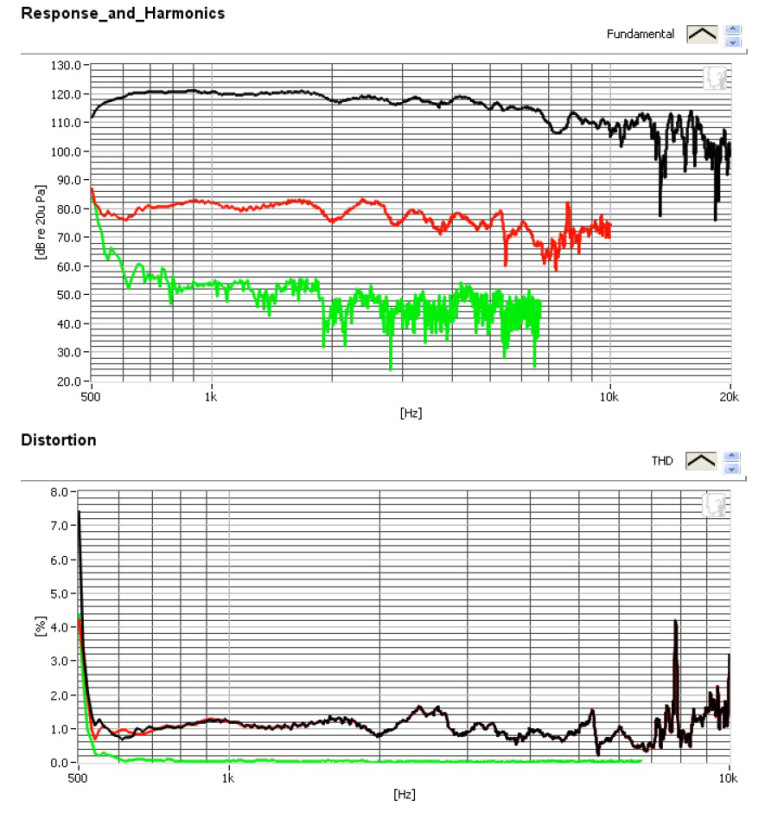
I mounted the DE110/ME10 combination in free air and set the SPL to 104 dB at 1 m (1.58 V, determined by 300 Hz 500 1K 2K 5K 10K 20K 40K using a pink noise stimulus generator and internal SLM in the SC14 software). I used the Listen microphone placed 10 cm from the horn’s mouth to measure the distortion.
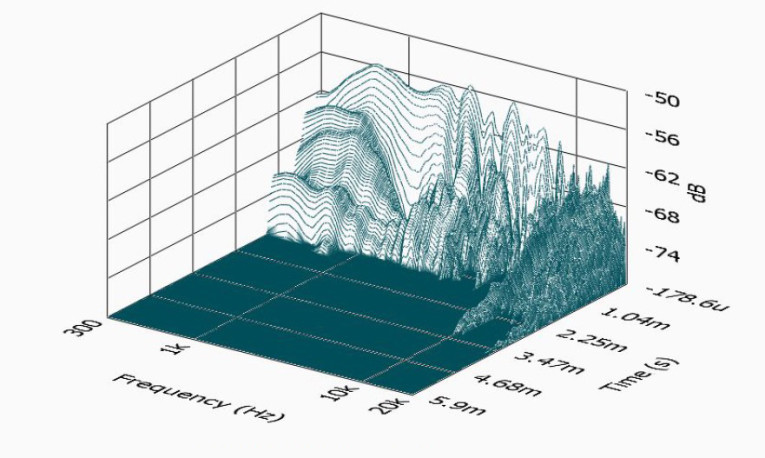
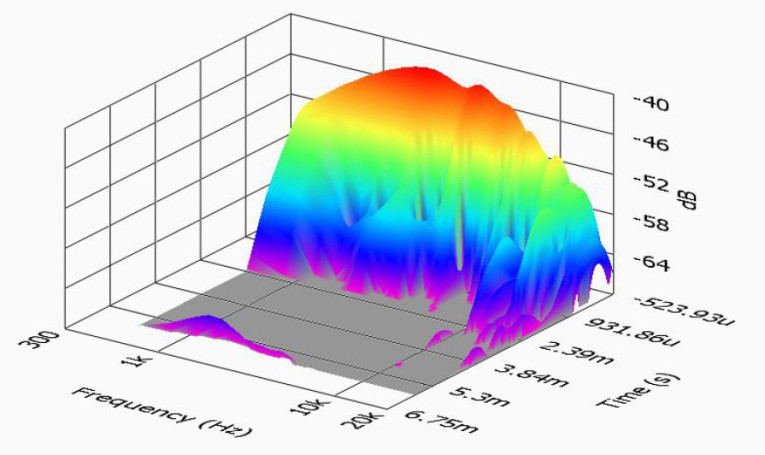
Figure 8 shows the distortion curves. I used SoundCheck 14 to generate a 2.83 V/1-m impulse response curve and imported the data into Listen’s SoundMap Time/Frequency software. Figure 9 shows the resulting CSD waterfall plot. Figure 10 shows the Short Time Fourier Transform (STFT) plot. Italian pro sound OEM B&C Speakers is a consistent manufacturer, with excellent build quality, performance, and engineering. For more information, visit www.bcspeakers.com.
This article was originally published in Voice Coil, September 2015.