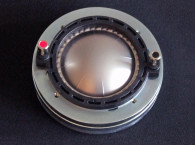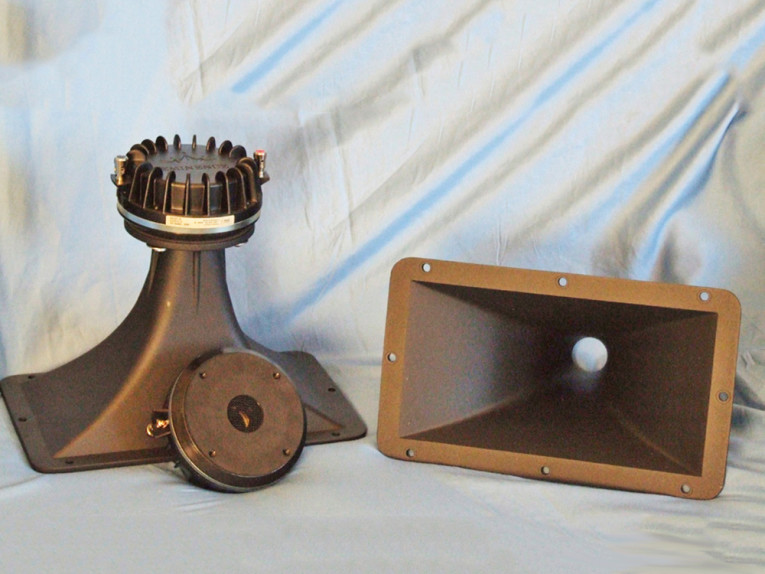
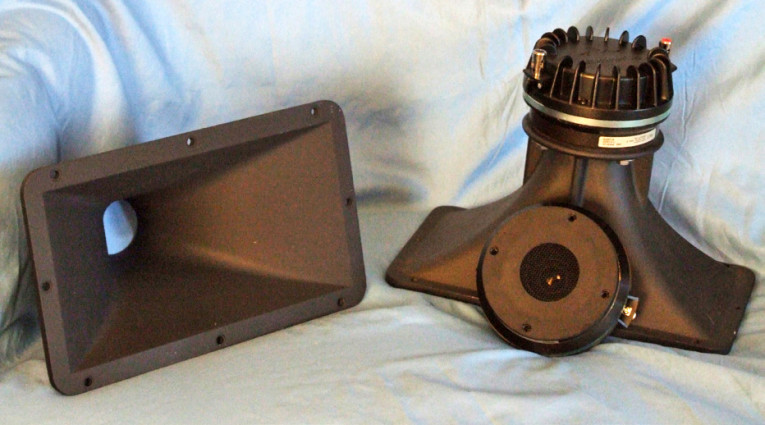
Both compression drivers are powered by an 11 oz neodymium ring magnet motor coupled to a titanium diaphragm driven by a 76 mm (3”) diameter voice coil wound on a polyimide former. The compression drivers are rated at 100 W (AES), and have a recommended minimum crossover frequency of 800 Hz at 12 dB/octave.
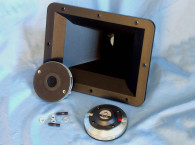
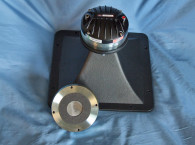
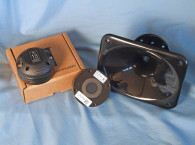
Other features include an injection-molded aluminum black heatsink, and color-coded chrome push terminals. The horn supplied with the N314T-8 is Eminence’s new cast-aluminum H14EA exponential profile horn with a 1.4” throat, a 60” × 40” coverage, and 0.6 kHz cutoff frequency. The horn supplied with the N320T-8 is the cast-aluminum H2EA exponential profile horn with a 2” throat, a 60” × 40” coverage, and 0.7 kHz cutoff frequency.
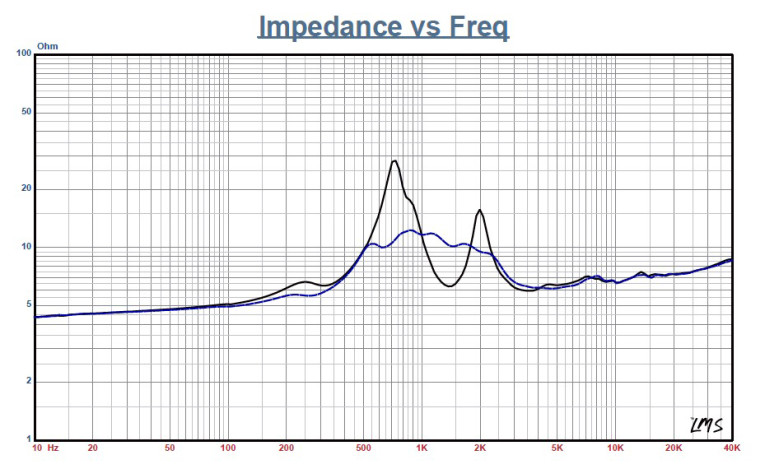
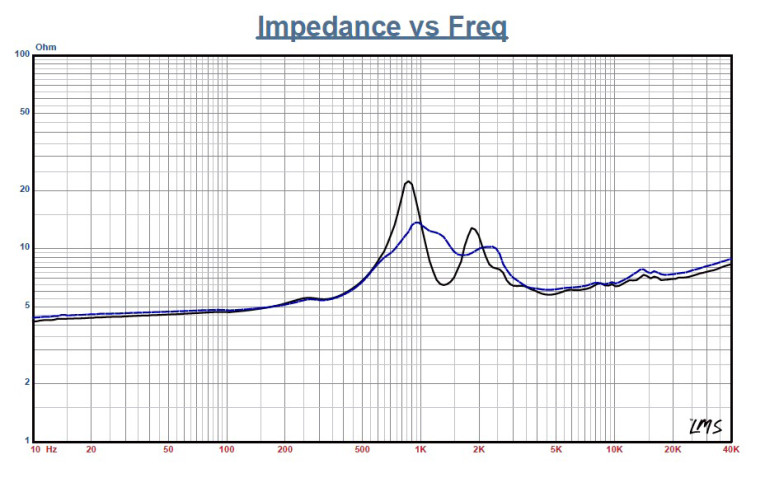

Testing for both compression drivers, the N314T-8 and the N320T-8 began using the LinearX LMS analyzer to produce the 300-point stepped sine wave impedance plots shown in Figure 1 and Figure 2, respectively, with the solid black curve represents the compression driver without the horn, and the dashed blue curve represents the compression driver with the horn. The N314T-8 had 4.69 Ω DCR, with the minimum impedance of the driver/horn measuring 6.14 Ω and at 4.6 kHz. The N320T-8 had a 4.63 Ω DCR and a minimum impedance of the driver/horn combination measuring 6.12 Ω at 4.6 kHz.
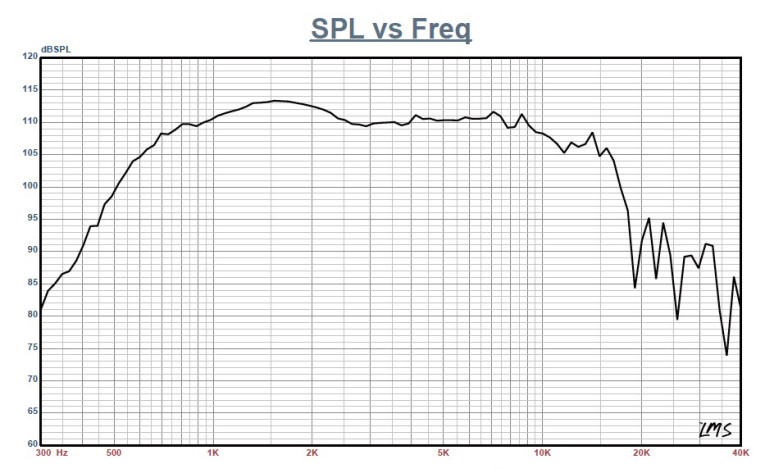
For the next set of frequency response tests, I free-air mounted both drivers/horn combinations without an enclosure and measured the horizontal and vertical on and off-axis at 2.83 V/1 m using a 100-point gated sine wave sweep from 0° on-axis to 60° off-axis. Figure 3 shows the N314T-8 compression driver/horn combination’s on-axis frequency response, which is smooth with no major anomalies ±2.5 dB from 1 kHz to 10 kHz, with a declining response as frequency increases above 10 kHz. The N320T-8 depicted in Figure 4 shows a similar smooth response with no major anomalies ±1.5 dB from 1 kHz to 6.75 kHz with a declining response as frequency increases above 7 kHz.
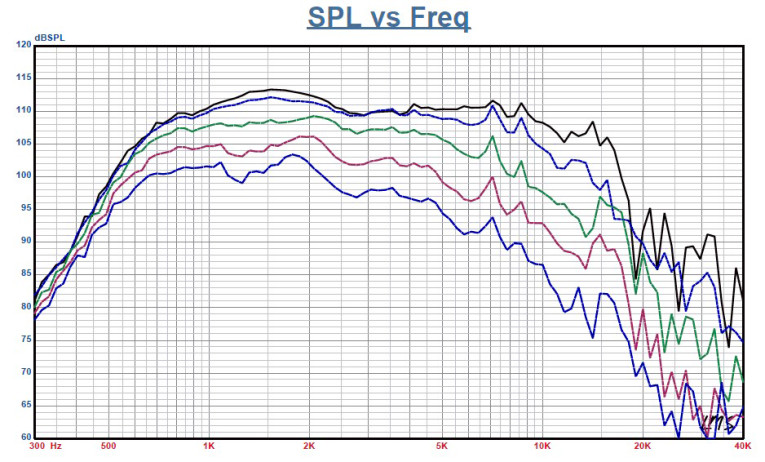
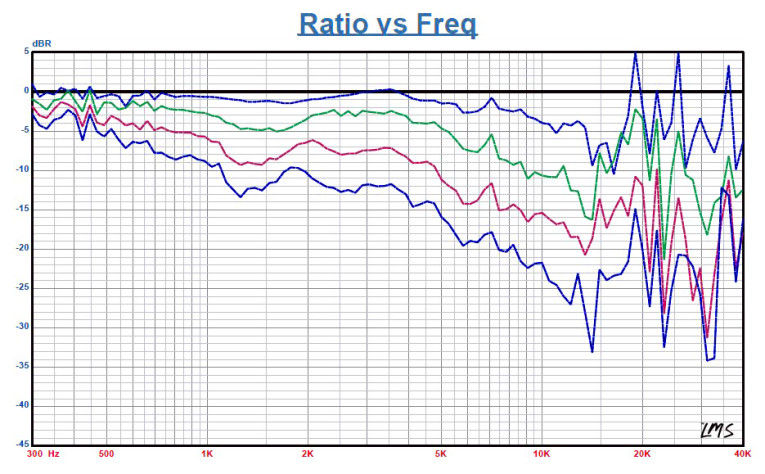

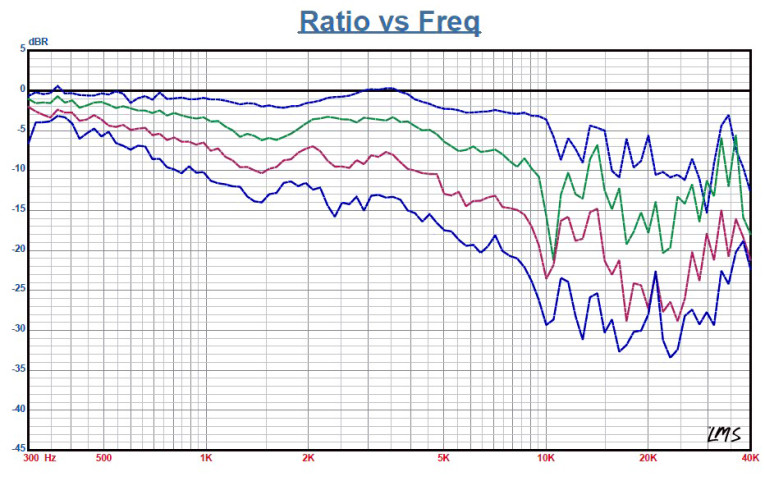
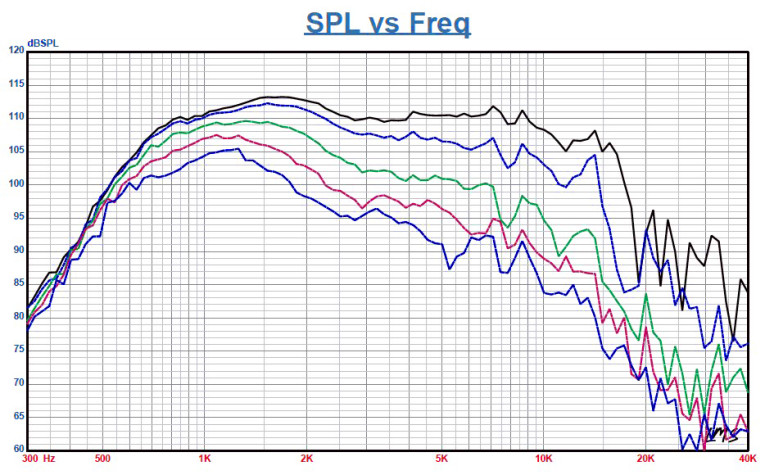
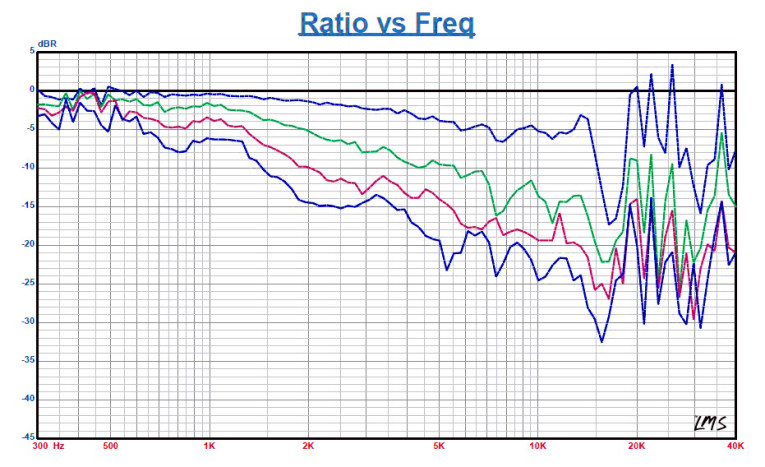

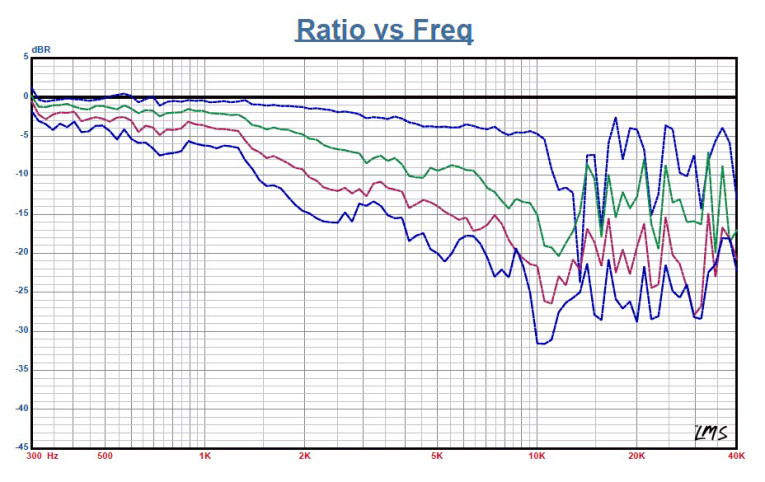
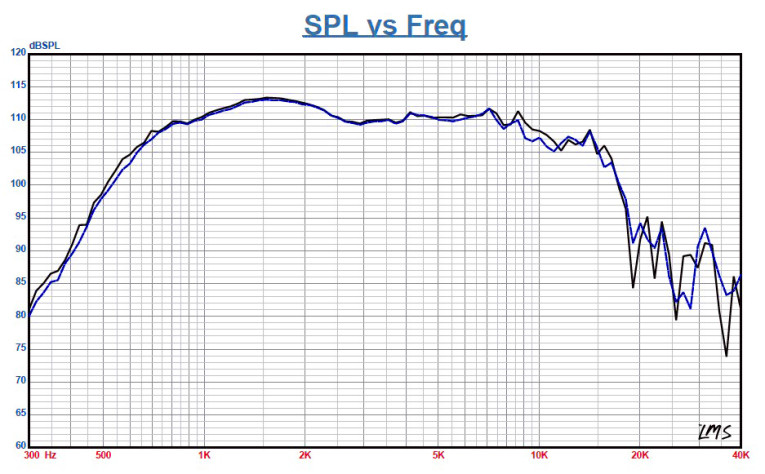
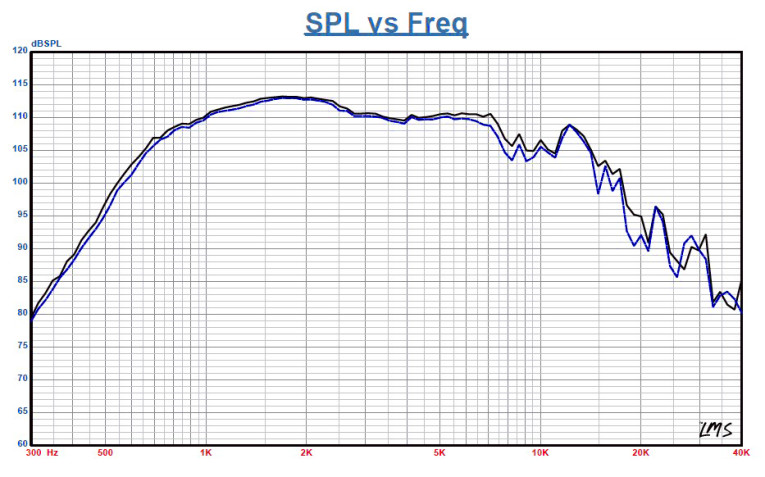
Figure 5 shows the on- and off-axis response in the horizontal plane out to 60°. Figure 6 shows the N314T-8’s normalized horizontal plane response. The same data is displayed for the N320T-8 in Figure 7 and Figure 8. Looking at the vertical plane on both of the compression driver/horn combinations, Figure 9 depicts the on- and off-axis response in the vertical plane. Figure 10 shows the N314T-8’s normalized vertical plane response. The same data is shown for the N320T-8 in Figure 11 and Figure 12. Figure 13 has the two-sample SPL comparison showing the N314T-8 compression driver/horn samples to be closely matched. The same comparison is shown the N320T-8 in Figure 14, except for a 1 to 2 dB deviation above 6 kHz.
For the remaining series of tests, I cranked up the Listen Inc. AmpConnect ISC analyzer, 0.25” SCM microphone, and power supply to measure distortion and generate time-frequency plots. I should note that this is the first Voice Coil issue in which I use latest version of SoundCheck with the company’s new logo, SoundCheck 14.
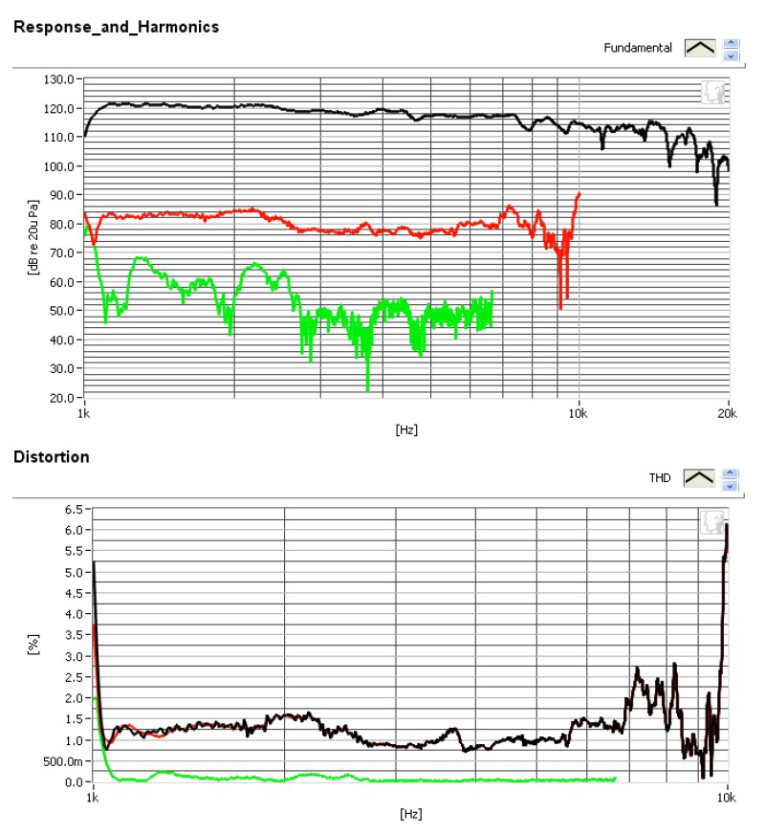
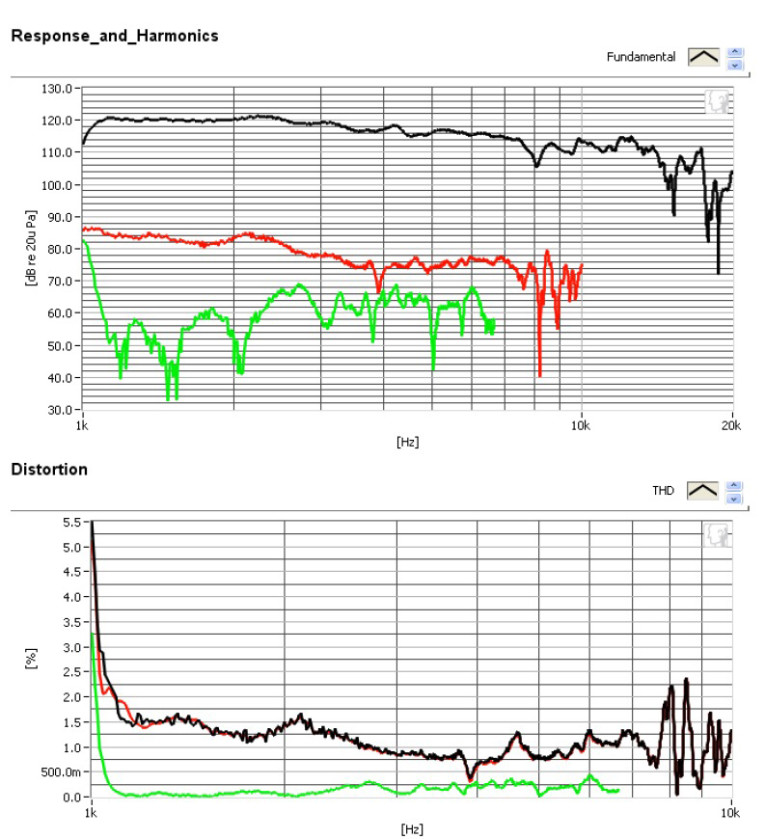
For the distortion measurements, I mounted the compression driver/horn combinations in free-air (as was done for the LMS frequency response measurements) and set the sound pressure level (SPL) to 104 dB at 1 m, using a pink noise stimulus generator and an internal SLM in the SoundCheck 14 software (1.53 V for the N314T-8 and 1.63 V for the N320T-8). Then, I measured with the distortion with the Listen SCM microphone placed 10 cm from the mouth of the horn. This produced the N314T-8/H14EA’s distortion curves (see Figure 15) and the N320T-8/H2EA’s distortion curves (see Figure 16).
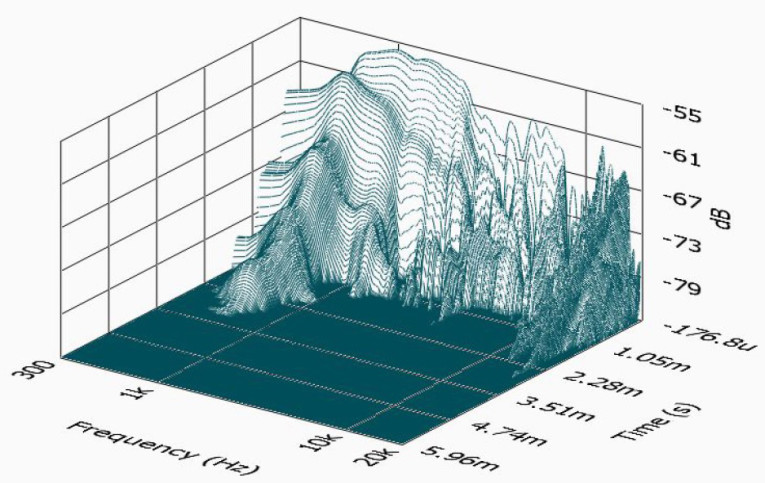
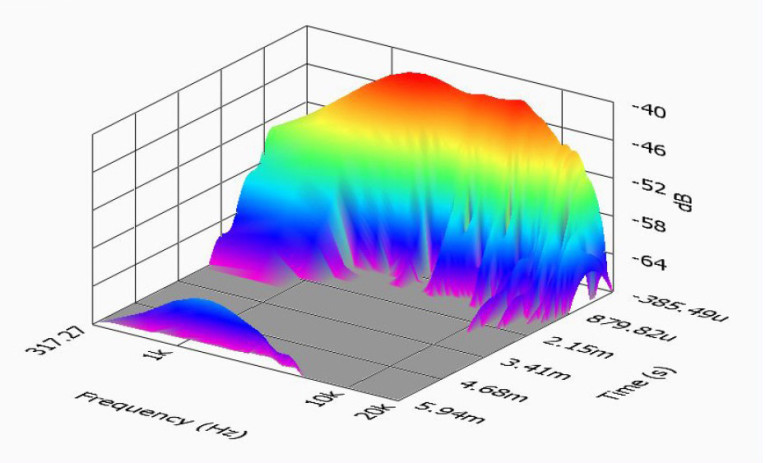
Following this test sequence, I set up SoundCheck 14 to generate a 2.83 V/1 m impulse response curve for both driver/horns and imported the data into Listen’s SoundMap Time/Frequency software. The resulting CSD waterfall plots are shown in Figure 17 and Figure 18. The Short Time Four Transform (STFT) plots are shown in Figure 19 and Figure 20, respectively.
For many years, Eminence was primarily known for woofers, especially its guitar speakers. However, with all the PSD compression drivers and now the new neodymium N314T-8 and the N320T-8, Eminence is clearly a world class OEM pro sound driver manufacturer. I would also like to congratulate Eminence on its 50th year anniversary and for being the biggest OEM driver manufacturer in America!
For more information, visit www.eminence.com.


This article was originally published in audioXpress, March 2016.