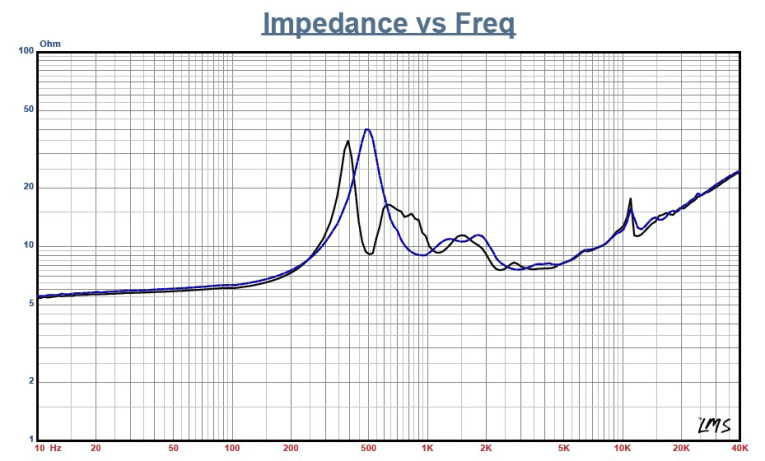
Testing began using the LinearX LMS analyzer to produce the 300-point stepped sine wave impedance plot shown in Figure 1. The solid black curve was obtained with the PD.CD2N mounted on the ME60 horn and the dashed blue curve represents the compression driver without the horn. With a 6.02 Ω DCR, the minimum impedance of the PD.CD2N/ME60 was 7.6 Ω and at 2.3 kHz.
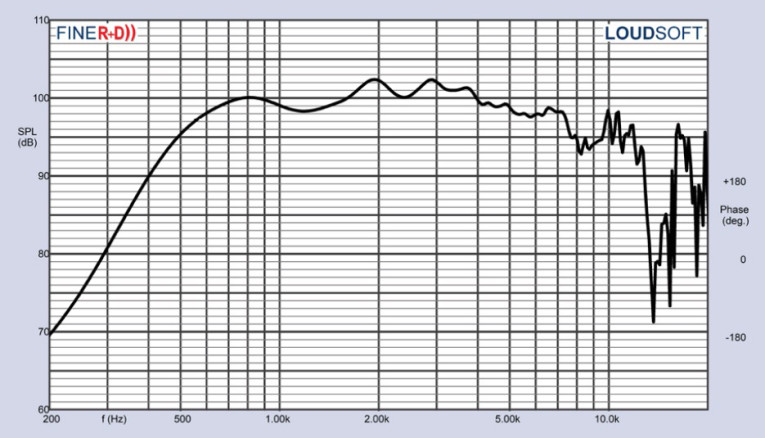
For the next set of sound pressure level (SPL) measurements, I free-air mounted the PD.CD2N / ME60 combination without an enclosure and used the LOUDSOFT FINE R+D analyzer and G.R.A.S. 46BE microphone to measure both the horizontal and vertical on and off axis at 2.83 V/1 m from 0° on axis to 60° off axis. Figure 2 displays the on-axis frequency response of the compression driver/horn combination, which is smooth with no major anomalies, with a declining response as frequency increases above 4 kHz typical of constant directivity horns. As previously mentioned, Precision Devices’ recommended crossover frequency for the PD.CD2N is 1.6 kHz with a third-order or higher high-pass filter.
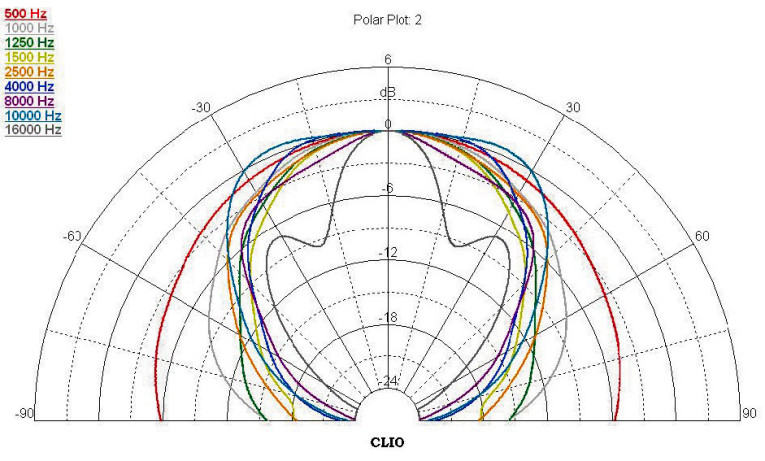
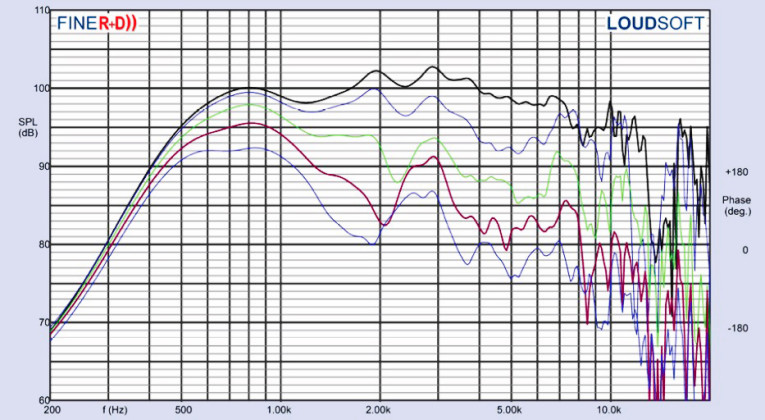
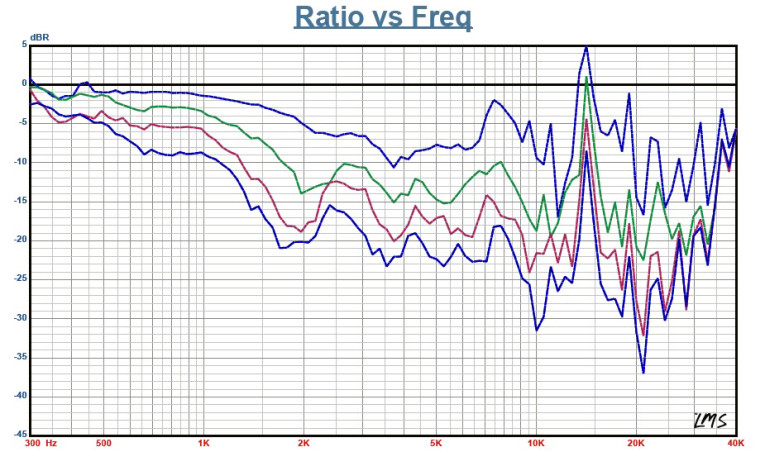
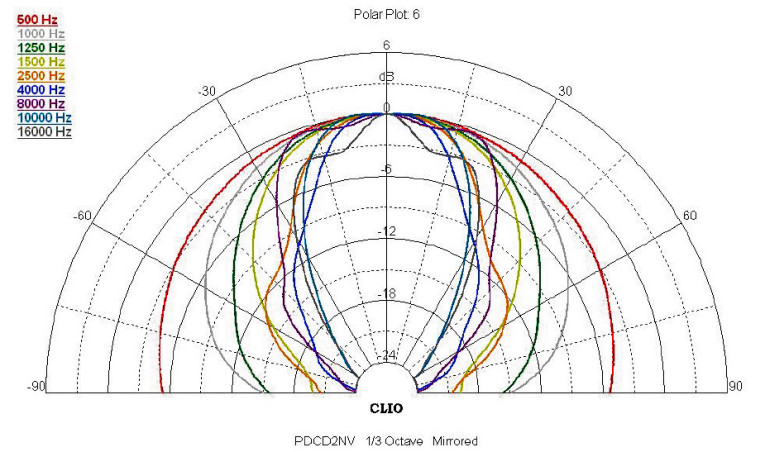
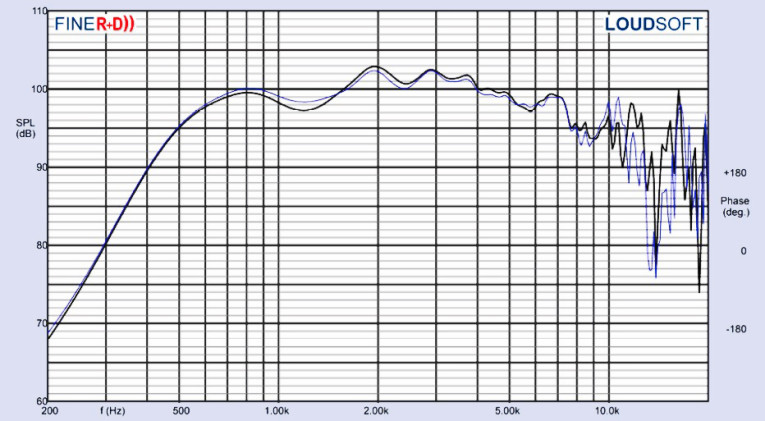
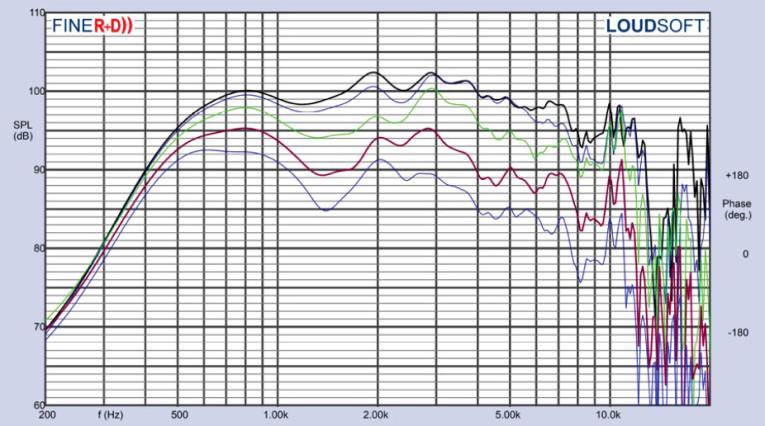
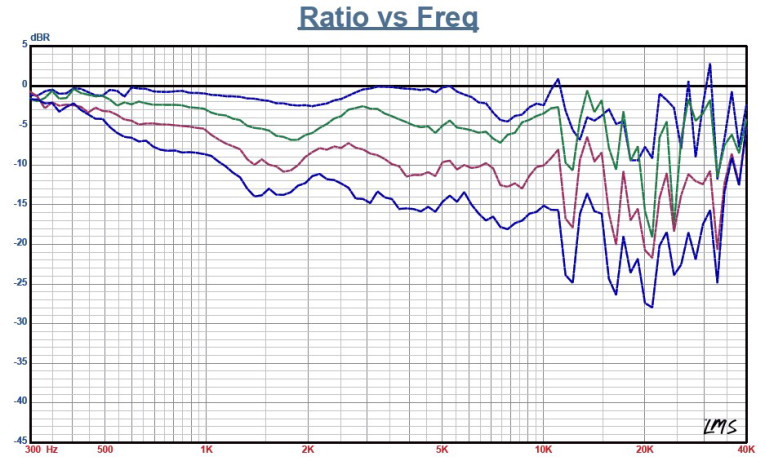
Figure 3 shows the on- and off-axis response in the horizontal plane. Figure 4 displays the normalized horizontal plane response. Figure 5 shows the CLIO Pocket analyzer generated the horizontal polar plot (in 10° increments with 1/3 octave smoothing applied). Figure 6 gives the on- and off-axis response in the vertical plane. Figure 7 depicts the normalized vertical plane response. Figure 8 shows the CLIO Pocket generated polar plot (in 10° increments with 1/3 octave smoothing applied). Last, Figure 9 shows the two PD.CD2N compression driver samples to be closely matched within 1 dB or less above the recommended crossover frequency of 1.6 kHz.
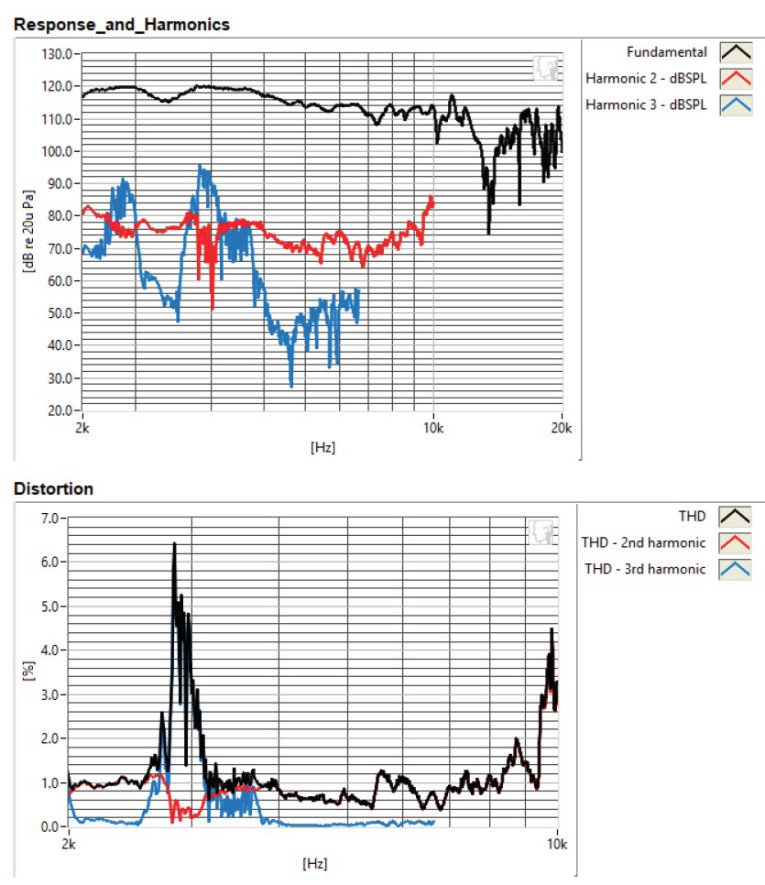
For the remaining series of tests, I set up the Listen, Inc. AmpConnect ISC analyzer and 0.25” SCM microphone and power supply to measure distortion and generate time-frequency plots. For the distortion measurement, I once again mounted the PD.CD2N/ME60 combination in free air in the same manner as was used for the frequency response measurements and set the SPL to 104 dB at 1 m (1.9 V determined by using a pink noise stimulus generator and internal SLM in the SoundCheck 15 software).
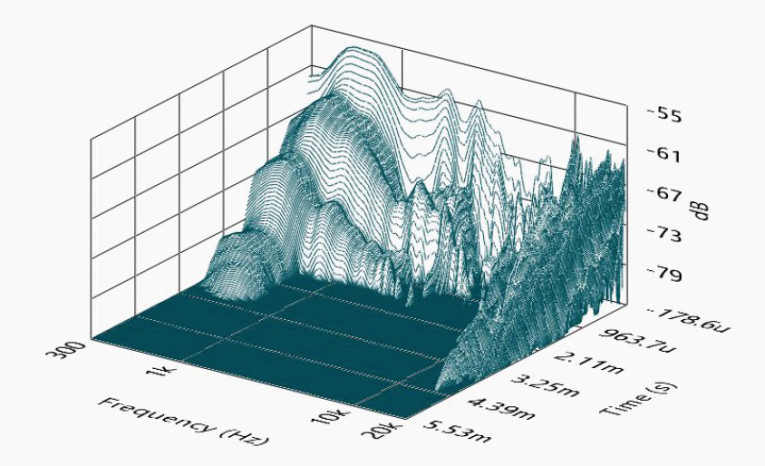
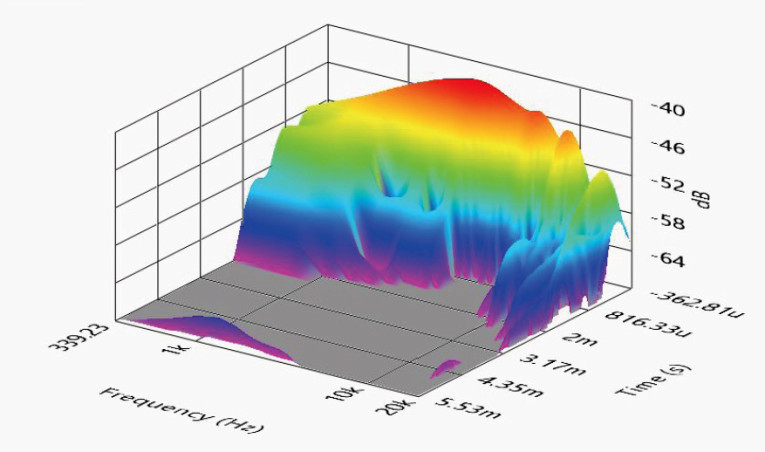
Then, I measured the distortion with the Listen microphone placed 10 cm from the mouth of the horn. This produced the distortion curves shown in Figure 10. Following this test sequence, I then set up SoundCheck 15 to generate a 2.83 V/1 m impulse response curve for this driver/horn combination and imported the data into Listen’s SoundMap Time/Frequency software. Figure 11 shows the resulting cumulative spectral decay (CSD) waterfall plot. Figure 12 shows the Short Time Fourier Transform (STFT) plot.
Taken overall, the UK manufactured Precision Devices PD.CD2N is an efficient and good performing compression driver, with a build quality as good as I have seen in the pro sound OEM industry, which is saying a lot. For more information, visit
www.precision-devices.com. VC
This article was originally published in Voice Coil, February 2018.