One factor that is often overlooked when working with T/S parameters is that they are small-signal parameters. When making small signal measurements of a driver, the displacement of the voice coil is kept to a minimum to provide a linear model. Having a linear model allows the measured parameters to be effective in the design process. All is then well with the world until the first time you use the resulting speaker to reproduce music at any level above a whisper.
Nonlinearities
Then, the demons of driver nonlinearity rear their ugly heads. Do you have a T-Rex tromping through the house that sounds more like a drunken cat, or a space shuttle launch that sounds more like your neighbor’s misfiring lawn mower? Most likely, the sound you’re hearing is the result of driver nonlinearity manifesting itself as distortion.
It’s interesting to watch people agonize over minute differences in speaker small-signal parameters when choosing a driver for a new speaker and yet totally disregard the fact that using a driver out of its linear operating area will radically change the character of the reproduced sound in a very negative way.
Nonlinearities that typically affect dynamic drivers are:
1. Force factor (Bl) changes with distance from a rest position.
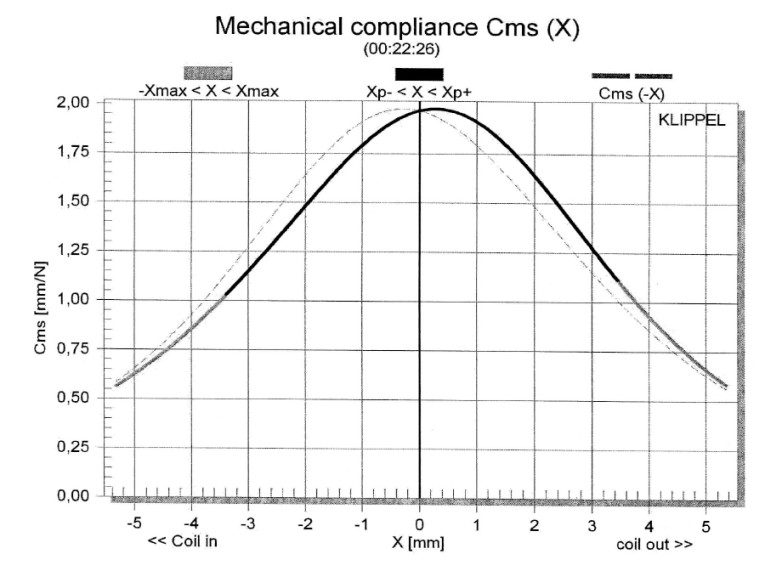
2. Compliance changes with distance from a rest position.
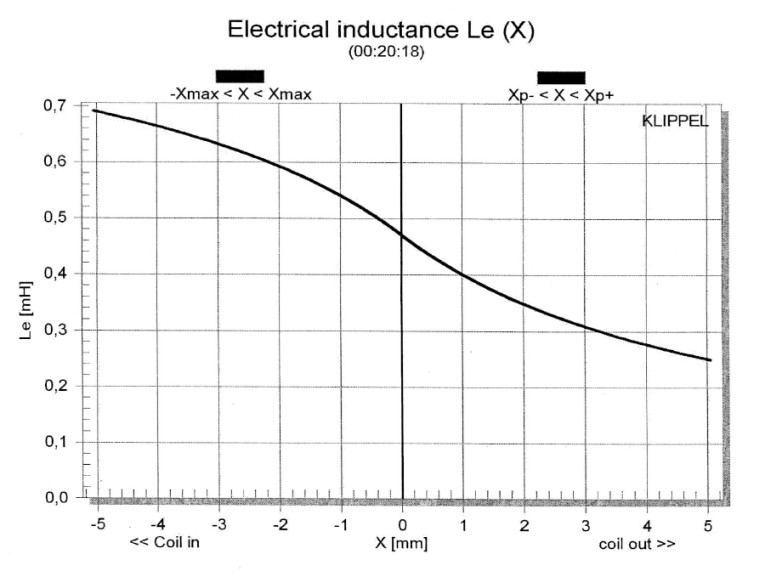
3. Asymmetrical voice-coil inductance, that is inductance that changes differently as the voice coil moves in different directions from the rest position.
4. Variable voice-coil impedance with temperature.
5. Flux modulation.
6. Change of frequency response with position (typically due to surround resonance, resulting in IM distortion).
7. Doppler distortion.
8. Suspension hysteresis and thixiotropy.
There are other nonlinearities that can affect the sound of a finished speaker, including but not limited to:
1. Enclosure leaks or flexing (may not be nonlinear).
2. Mechanical or acoustical noises from the driver, port, and so on.
3. Decentering of the diaphragm motion, or “oil-canning”.
4. Gross suspension problems such as inversion of the surround.
5. Drive amplifier current limitations due to extreme impedance excursions.
The good news is that there are measurement methods you can use to determine and quantify the first four, and sometimes other nonlinearities just mentioned. Two methods that have reached the practical stage are the DUMAX system (Drive Unit Measurements At eXcursion) produced by DLC Design of Wixom, MI, and the Klippel Analyzer System by Klippel GmbH of Dresden, Germany. They use very different approaches to measure the nonlinearities. However, both have produced results that successfully model driver behavior under large signal conditions. If you wish to get into the technical details on these methods, information on them is available in the form of AES papers listed in References.
Distortion
How do these nonlinearities produce distortions? Results depend to some degree on whether the driver is being operated above resonance where it is mass loaded or below resonance where it is compliance loaded.
For force factor, whether in the mass loaded or compliance loaded range, in order for diaphragm motion to be linear, the driving force must be linear across the desired range of movement. If the driving force produced by the voice coil/magnet structure for a given drive signal changes as the coil moves through its excursion range, the force on the coil, and therefore the diaphragm, will not be linear, resulting in distortion.
For compliance, you might think that because the driver is mass loaded above resonance, compliance nonlinearities would only matter below resonance. While they are certainly very important in this range, they can also affect the driver above resonance.
To visualize this, think of a driver above resonance with a magnetic structure having unlimited linear excursion capability. Also think of the suspension having a compliance that is totally linear throughout most of its range, but also having a “brick wall” change in compliance when it reaches a certain distance, much like having a mechanical stop on both sides of the voice coil. It is easy to visualize that, above resonance, until the “brick wall” compliance limit is reached, as drive level is increased, the mass being constant and dominant will result in linear output.
However, once the artificial stops are reached, the output will certainly be distorted, much the same as when an amplifier goes into clipping. In reality, the compliance changes are not that dramatic unless the voice coil former strikes the back plate. However, as the excursion from the rest point increases, the compliance decreases. This additional resistance to movement adds to the inertia of the mass in a nonlinear way with excursion, resulting in distortion.
Although not related to the driver mass, to help visualize what is happening, you can think of suspension nonlinearity as adding a mass delta to the system with increasing excursion. Unlike mass, the compliance force is always in the direction of the rest position and is largely affected by distance rather than acceleration. Therefore, it is really not a true analogy. With Einstein, you gain mass as you approach the speed of light.
In this technically incorrect, but hopefully enlightening analogy, you can think of the driver as gaining mass as you approach the suspension limits. In reality, the compliance limits can produce a force opposing diaphragm movement that is greater at some point in the excursion range than the effect of the driver’s mass. In practice, you can see the effect of this “added mass” as a decrease in FS with increasing drive level. It should now be clear that any evaluation of a driver is not complete without information that indicates the limits of excursion that will result in a relatively linear output.
Although there are no absolute guidelines, generally accepted limits for force factor and compliance changes are a reduction of Bl to 70.7% of the rest position value and a reduction of compliance to 25% of the rest position value. Traditionally, XMAX is determined by a physical measurement of the voice coil and gap heights. This is a very simplistic approach that is at best a rough approximation of Bl limited excursion and does not take into account any compliance limits.
I’ve worked with drivers that were limited by Bl changes where there was plenty of linear compliance left and also the opposite case, where compliance limits strangled an otherwise very competent motor structure. An effective XMAX specification will take into account both factors separately, and for both directions of travel. In each direction, the smaller excursion where either limit is reached should be used.
The two excursion values should be added, and XMAX specified as half of the total value, even if the excursion to one side is greater.
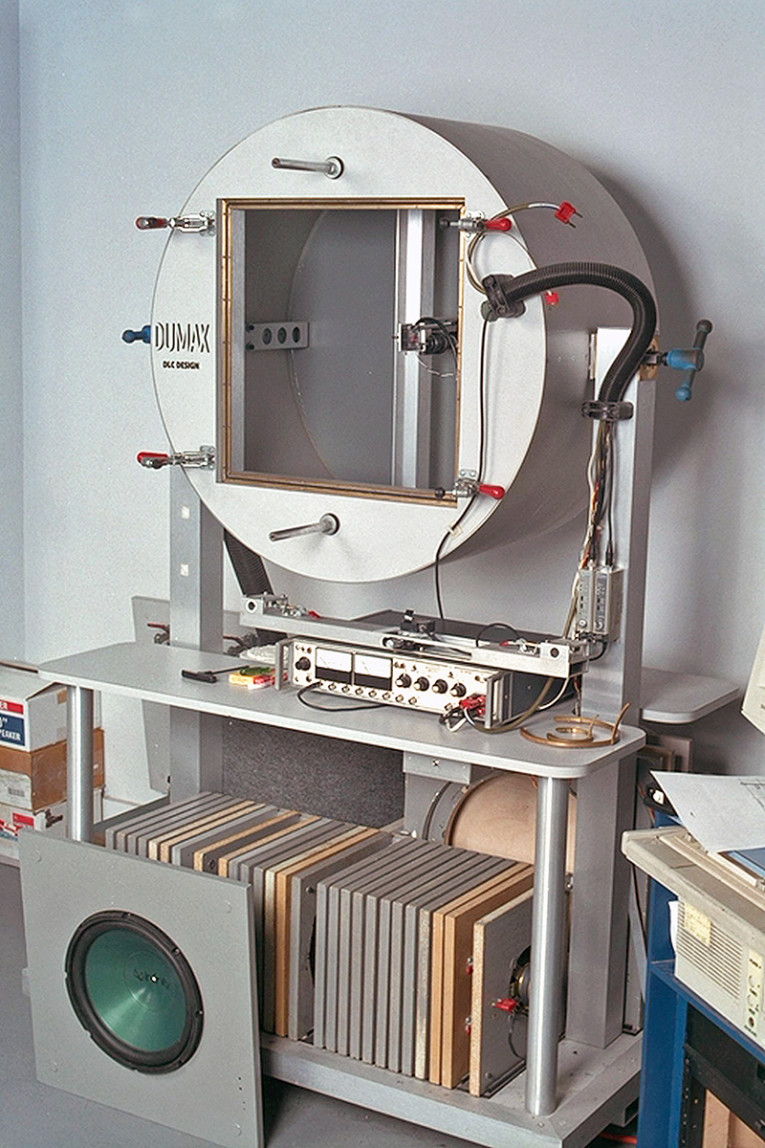
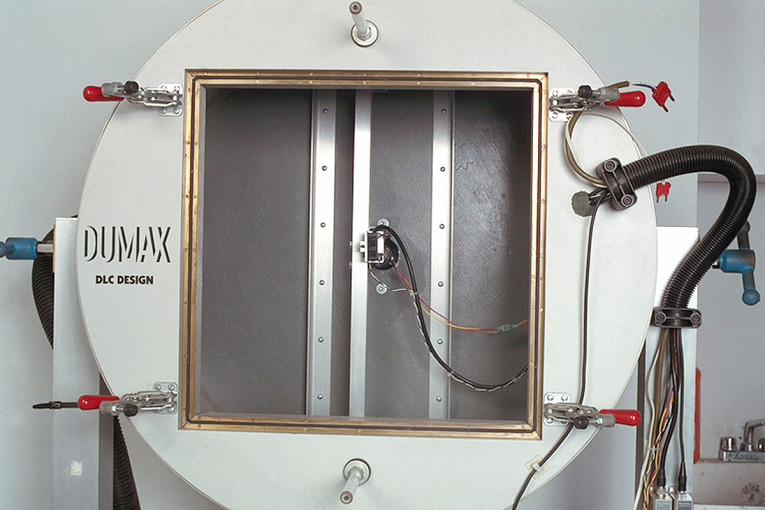
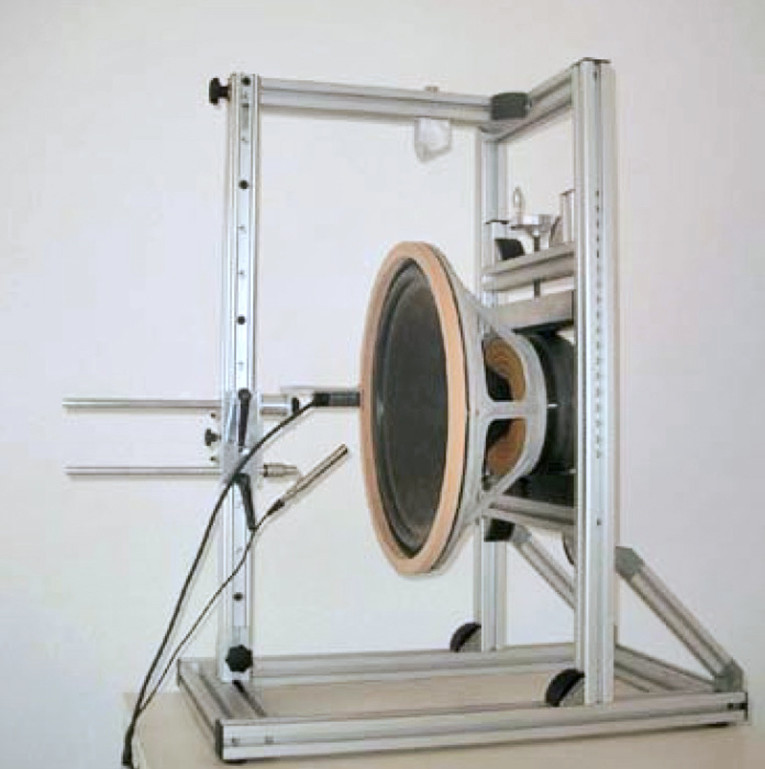
DUMAX
The DUMAX system(1) uses a special chamber to control offset from the rest position of the driver by applying a static pneumatic pressure. Photo 1 shows the DUMAX system prior to mounting a driver. Measurements of driver electromechanical parameters are then made at various offsets. These measurements can be mapped to T/S parameters if desired, but can be used in a nonlinear model, which the T/S parameters cannot. The minimum set of parameters includes:
1. MMD = moving mass of diaphragm (kg)
2. CMS = suspension mechanical compliance
3. RMS = mechanical resistance (N . s/m)
4. Bl = motor force factor
5. RE = resistance of voice coil (ohms)
6. SD = diaphragm area (m2)
The measurement system used by DUMAX includes:
1. The test chamber
2. Laser position transducers for the diaphragm and magnet positions
3. A chamber pressure transducer
4. A test microphone inside the test chamber with a preamplifier
5. A known non-magnetic mass
6. A voltage-controlled pressure source
7. A current-source amplifier with remote sense
8. A Windows computer with data and acquisition cards and various measurement and analysis software
With DUMAX, primary emphasis is placed on changes in force factor and compliance, as these errors can occur repeatedly even when drivers are operated well within maximum power ratings due to the dynamic nature of music compared to test signals. Testing a driver is done in several stages.
Driver Measurement
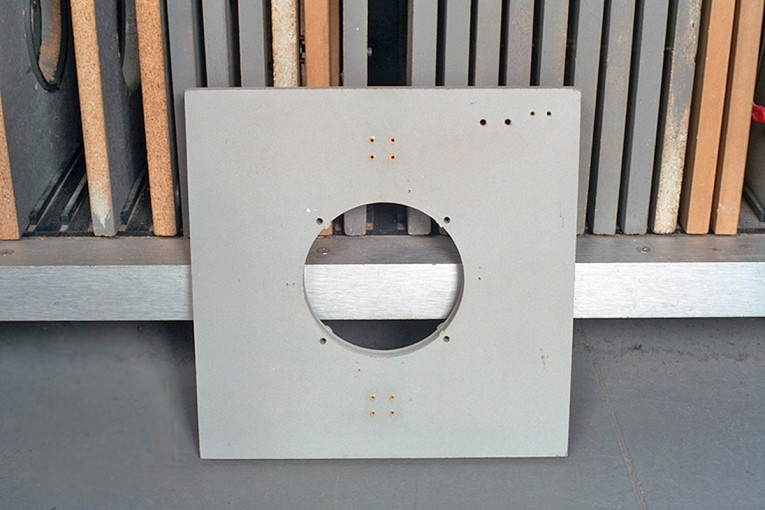
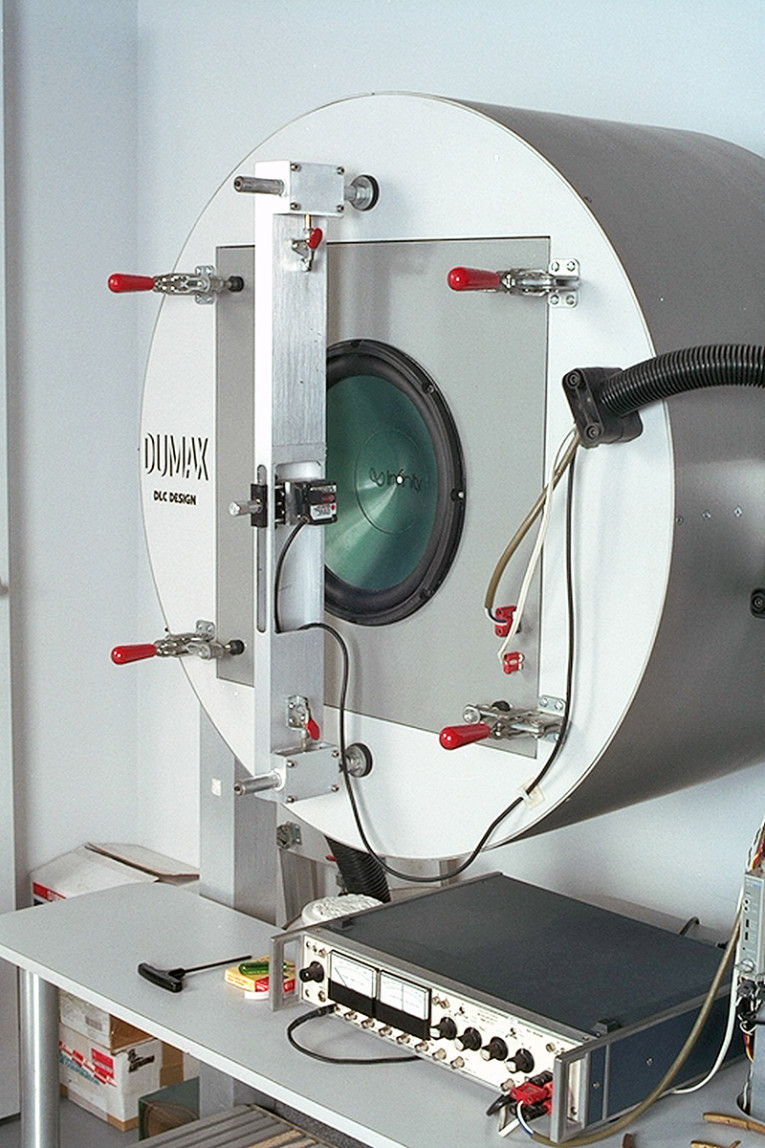
Driver preparation begins with selection of an appropriately sized baffle. Photo 2 shows an example of one of the many baffles needed to test the great range of drivers that pass through DLC Design.
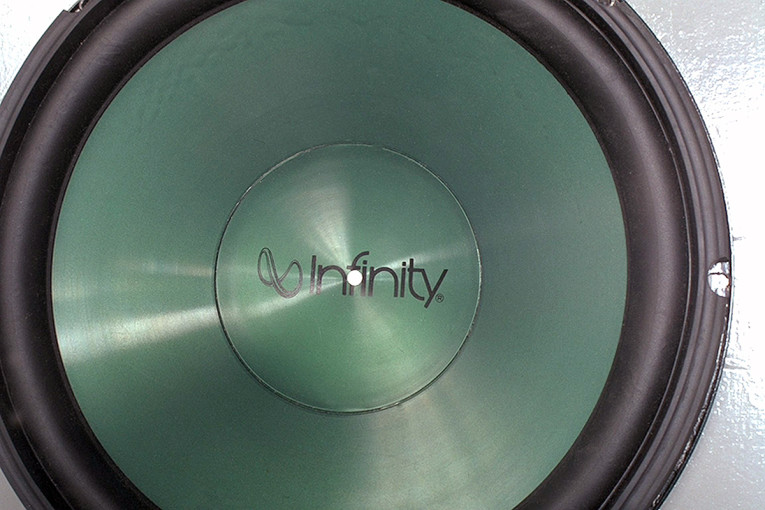
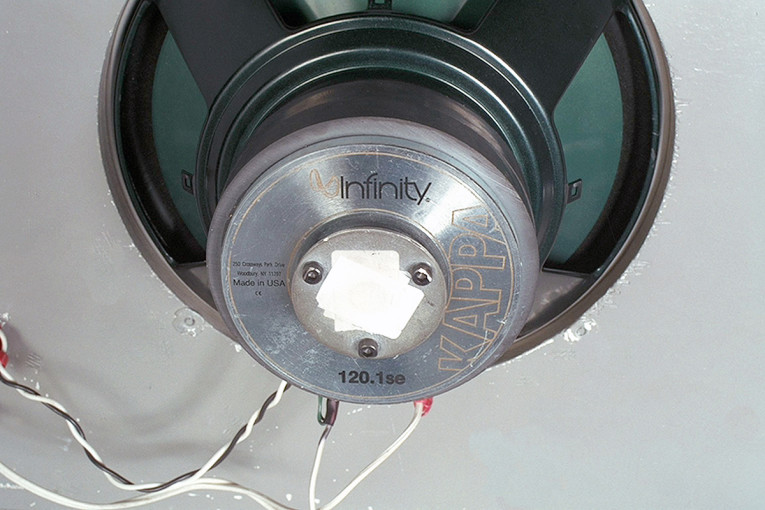
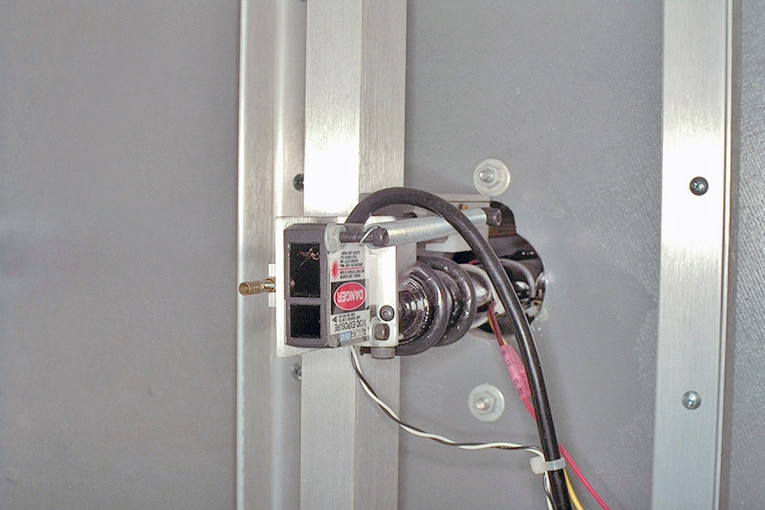
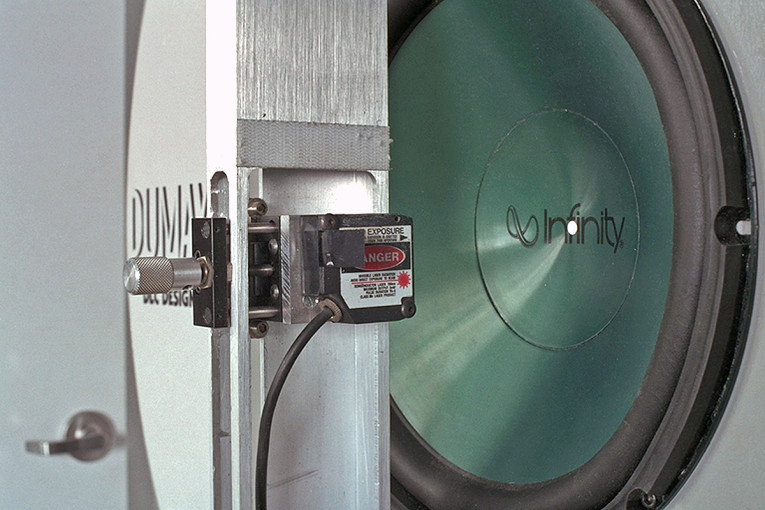
Two reference marks are put on the driver, one on the dustcap (Photo 3), and the other on the rear of the magnet structure (Photo 4). These marks are targets used by the laser positioning system. One laser is inside the chamber to measure the rear of the driver (Photos 5 and 6). The other laser is on the outside of the chamber to measure the position of the dustcap (Photos 7 and 8).
Precise measurement of the diaphragm position in relation to the frame is necessary in several of the tests for reasons I describe here. Changes such as bowing can occur in the shape of the test chamber housing as the static pressures are changed, affecting measurement accuracy. The driver is then mounted to the baffle and secured to the test chamber. Once sealed in the chamber, pneumatic force is used to extend the diaphragm to both extremes of excursion and then back and forth with 1mm less excursion for each cycle until back at the rest position. This “break-in” eliminates any offset in the normal rest position due to storage effects.
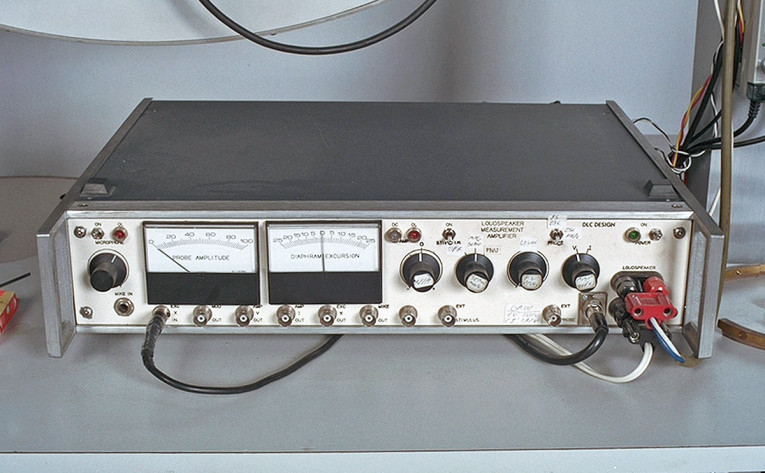
Next, force factor (Bl) is measured both at rest and as a function of excursion. After measuring Bl at the rest position, acoustic pressure is used to offset the diaphragm to the new desired position, and a test tone in the mass-controlled frequency range is inserted from a current-source amplifier. A current-source amplifier is used to eliminate the effects of any changes in voice-coil inductance at various positions. Photo 9 shows some of the controls and meters on the custom current amplifier.
The resulting acoustic output measured by an internal microphone is proportional to the Bl, with little influence from stiction, and other nonlinear effects (Photo 10).
Measurements at different positions continue until a decrease in Bl to at least 50% of rest value — and even further if suspension compliance allows — is reached in both directions. The position in each direction where Bl reaches 70.7% of the rest value is designated as XMAG for that direction.
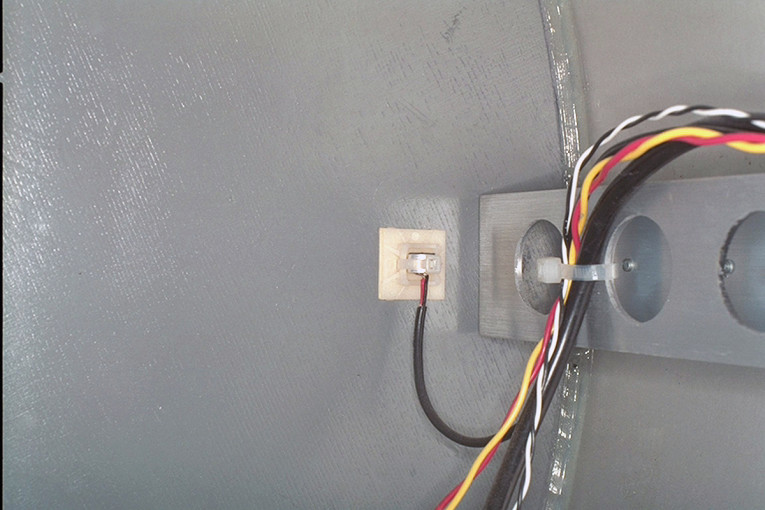
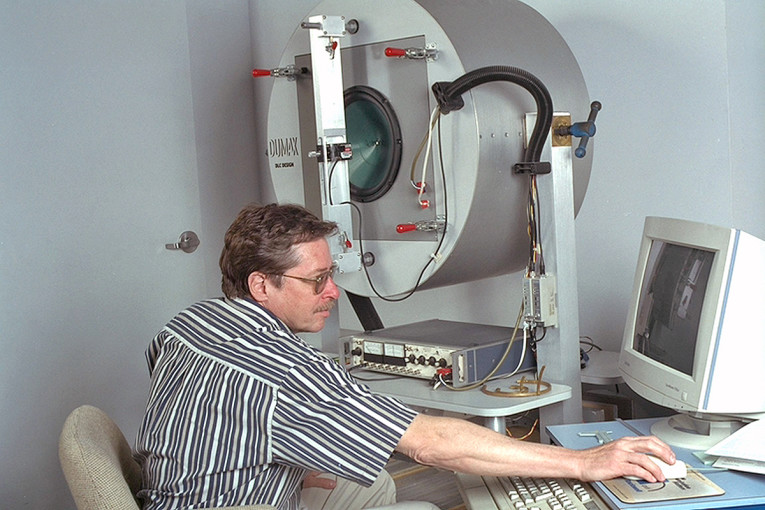
Photo 11 shows David Clark of DLC Design “at the console” making a measurement. Moving mass (MMD) can be measured in one of two ways. The first involves using the drivers’ magnetic force to balance the force of gravity acting on the mass while keeping the diaphragm in the same position. Very high accuracy in measuring the diaphragm position in relation to the driver basket is required to ensure that errors due to suspension movement are eliminated.
The test chamber with the driver mounted is rotated to the upward vertical position while maintaining the diaphragm position by injecting current into the voice coil. The amount of current needed to maintain that position is then measured.
The chamber is then rotated to the downward vertical position while again using current injected into the voice coil to maintain the diaphragm position. The amount of current to maintain the rest position is then measured. The difference between the two drive currents and the Bl force factor is used to calculate the driver mass.
The second method of measuring moving mass is the traditional added mass system, in which a known mass is added to the diaphragm and the change in resonance frequency measured. The use of a laser-pneumatic servo allows for a constant position of the diaphragm even when the mass is added, eliminating the compliance change induced errors that can occur when the suspension is displaced by the added mass in a more typical setup.
Measurement of compliance (CMS) is a bit more complicated than the previous parameters. There are actually six possible test methods that can be used, depending on the characteristics of the driver being tested. Some include driving the voice coil of the driver being tested, while others require no connection to the voice coil at all, enabling compliance measurements with the voice coil completely out of the gap, a position where driving the coil would obviously be of no use.
These include:
1. FS oscillation
2. Impedance curve
3. Acoustic maximum
4. Mechanical maximum
5. Voice-coil maximum
6. Acoustic transmission
Compliance is measured at various test points in both directions using static air pressure to position the diaphragm at each of the test points. A more complete description of the tests and results is given in the AES reprint. It is interesting to note that in one case, measurements of driver compliance were made to ±10mm, where the voice coil was only able to provide acceptable drive to a distance of −6mm to +8mm. Mechanical resistance (RMS), which is often assumed to be linear with velocity, is also measured. Nonlinearities that can disturb the normal assumptions can be due to friction, plastic deformation, and aerodynamic drag. In the DUMAX scenario, this parameter can be measured at different diaphragm positions.
Measuring voice-coil resistance (RE) is pretty straightforward. The most accurate method is to use separate measurements of the current through the voice coil and the voltage across the coil at the same time. You can do this yourself with two digital multimeters and a variable low voltage power supply.
Insert one DVM set to the DC current mode in series between the power supply and the voice coil. Next connect the other DVM set to the DC voltage mode across the voice-coil contacts. Slowly increase the voltage to the driver until a few hundred milliamps is measured with the DVM set to the current mode.
Note the voltage at that point. You might notice a slight drift in current as the voice coil heats up from even that low level of power. To determine the resistance, divide the voltage reading by the current reading, being careful to allow for decimal positions if using milliamps or millivolts instead of amps and volts. This is a far more accurate method than trying to use a DVM in the usually least accurate part of the resistance range and also trying to allow for lead resistance. With DUMAX, this four-wire measurement is made while measuring Bl with added mass. Effective diameter (SD) is determined by measuring the diameter of the diaphragm and one-third of the surround.
Measuring an oval speaker becomes a little tricky, but using a graph paper tracing and counting the squares that are more than 50% inside the one-third surround limit can help. For square or triangular shaped diaphragms, the calculations are easy. For unusual shaped diaphragms, measurements of force or pressure may be used.
Other parameters versus diaphragm position that can be measured using the DUMAX equipment, include:
1. Inductance
2. Semi-inductance
3. Diaphragm acoustic leakage resistance
4. Flux modulation by voice coil current
5. Thermal capacity
Parameters that are also sensitive to pressure can be measured, including:
1. Diaphragm flex
2. Surround or dome collapse
3. Magnetic fluid stability
Certainly, subjecting a driver to DUMAX analysis will result in far more useful modeling information than just the basic T/S parameters. Not only will limits beyond which the driver will be nonlinear be revealed, but more useful values for modeling parameters will be available, reducing the surprises that occur when going from T/S parameters to finished designs. In addition to graphical reports, measured parameters can be fed into other programs that can predict driver performance.
Klippel
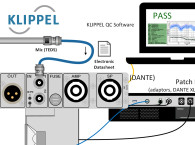
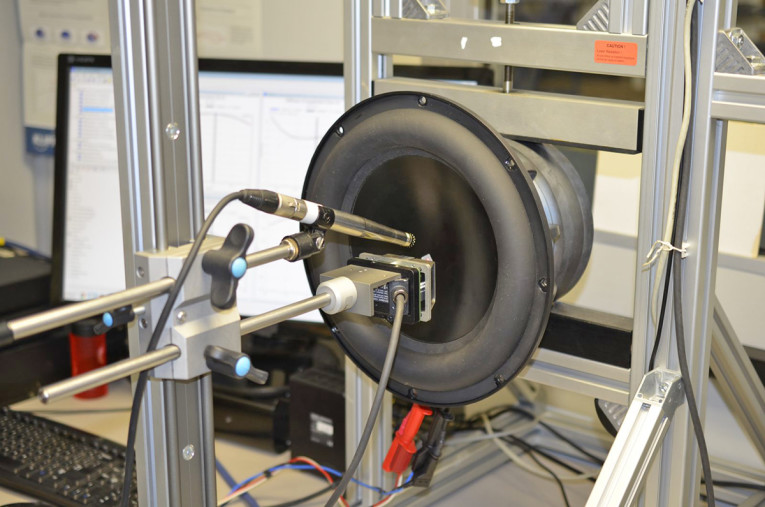
Like DUMAX, the Klippel Analyzer system (Photo 12) enables measurement of both linear and nonlinear parameters of a driver.(2) However, the system is quite different in hardware, software, and operation. While DUMAX measures parameters from normal to extreme operating conditions, Klippel operates the loudspeaker under normal working conditions and finds parameter values that are used to model the driver by digital realtime processing using a DSP.
Although DUMAX and Klippel both produce equivalent values of basic nonlinear parameters, DUMAX actually measures the parameters at the extremes of operating conditions, while Klippel uses the model to predict results under those conditions. Both methods have advantages, but for the purpose of evaluating basic nonlinearities, they both provide the information speaker builders need to evaluate different drivers.
In addition to the basic analyzer, the Klippel system has several different software modules that extend test capabilities to large-signal and linear-signal measurements, numerical simulations of speaker systems in different enclosures, auralization of modeled drivers using a high-quality speaker system to reproduce the linear and nonlinear aspects of the driver under test, and power testing which allows testing of drivers up to the point of destruction with different duty cycles while monitoring various variables and then producing a “death report.” All pertinent data from the various tests is stored in a database for analysis and presentation.
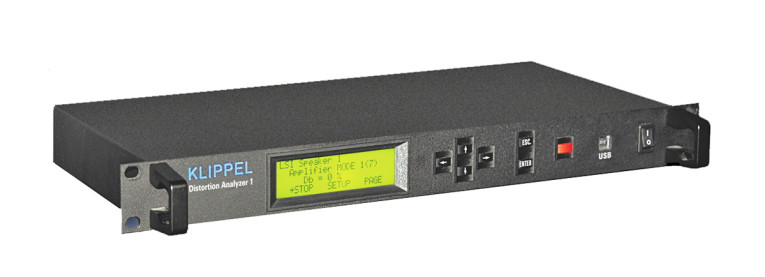
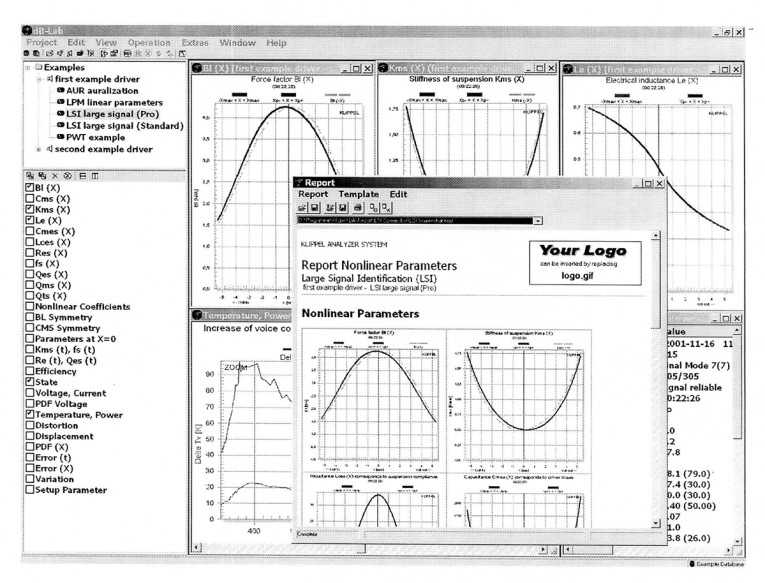
The heart of the system is a digital processing unit called the Distortion Analyzer 1 (Photo 13) that can be operated in stand-alone or computer-controlled modes. dB-Lab is the master software that controls the distortion analyzer and additional software modules (Fig. 1).
Output is in the form of HTML files with standard templates for report generation. Since this software is project oriented, projects may be organized in different workspaces, and custom setups, including comments, logos, and pictures, can be saved as templates for other reports.
Unlike DUMAX, the Klippel system does not use static air pressure to move the diaphragm to various positions in the driver excursion range. Rather, normal music or an audio-like signal (noise) is used to excite the driver, and measurements are taken from the coil current and voltage and, in some cases, position of the diaphragm using a laser for position information. All measurements are taken with the driver in free air or in a sealed enclosure.
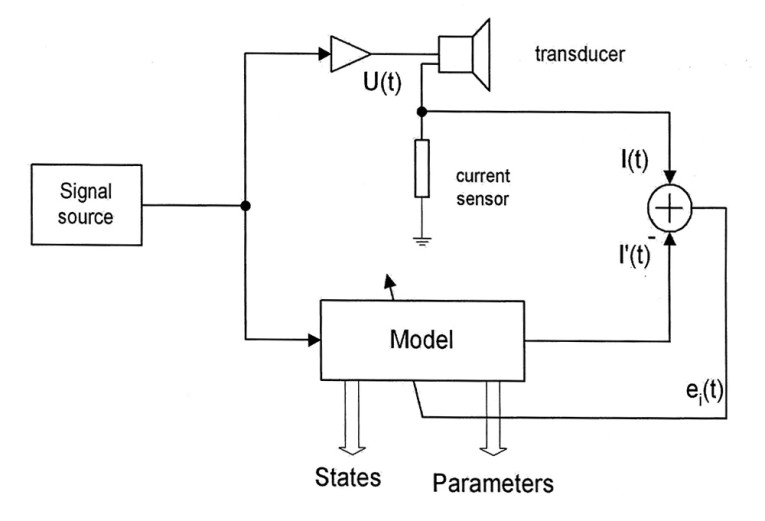
As measurements are taken, the modeling software receives voltage input from the driver terminals and predicts the voice-coil current that will result. The actual measured current is fed into the modeling program, which then adjusts the model until the differences in predicted and actually measured currents are minimized (Fig. 2). The resulting model parameters then most accurately reflect the driver parameters under those test conditions.
Testing begins in the small-signal domain and then proceeds in steps until the maximum amplitude is reached based on the identified parameters and thermal and mechanical protection limits.
The Klippel system uses software that can make it an automated system with both short-term and long-term tests that can extend for days. The driver is modeled by an electromechanical equivalent circuit described by the following parameters called state quantities:
1. x(t) displacement of the voice coil
2. v(t) velocity of the voice coil
3. I(t) the input current
4. u(t) the driving voltage at the driver terminals
5. P(t) real electrical input power
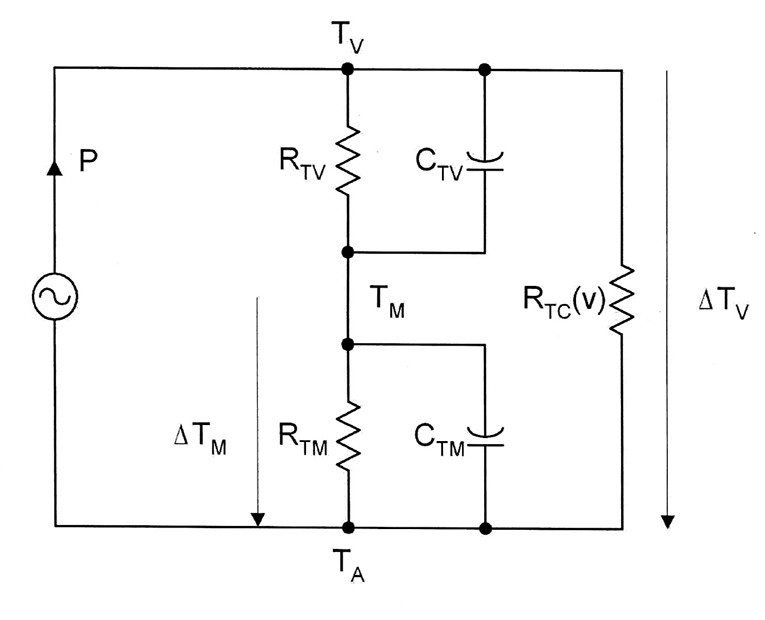
6. TV(t) voice-coil temperature
7. RTC(v) thermal resistance representing convection cooling
8. TM(t) magnet structure temperature
9. TA ambient temperature of the driver before testing
10.ΔTV(t)=TV(t)-TA increase of voice-coil temperature
11.ΔTM(t)=TM(t)-TA increase of magnet structure temperature
The relationship between the state quantities is represented by electromechanical and thermal equivalent circuits. Both linear and nonlinear elements are modeled.
Linear elements include:
1.MMS mechanical mass of driver diaphragm assembly including voice coil and air load
2. RMS mechanical resistance of total driver losses
3. RTV thermal resistance of path from coil to magnet structure
4. RTM thermal resistance of magnet structure to ambient air
5. CTV thermal capacitance of voice coil and nearby surroundings
6. CTM thermal capacitance of magnet structure
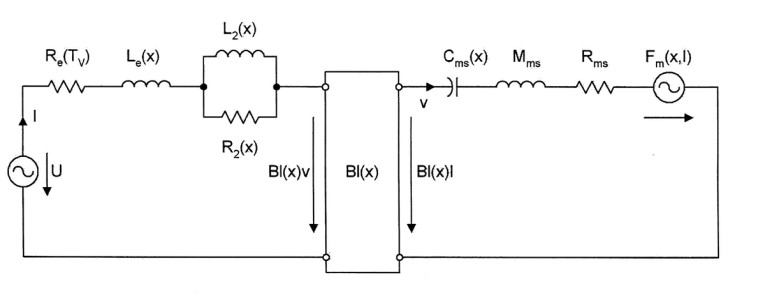
Nonlinear elements include:
1. Bl(x) instantaneous electrodynamic coupling factor (force factor of the motor) defined by the integral of the magnetic flux density B over voice coil length l
2. CMS(x,t)=1/ KMS(x,t) compliance of driver suspension + air load (the inverse of stiffness)
3. LE(x) part of voice-coil inductance which is independent of frequency
4. ZL(x,s) electric impedance representing the influence of eddy currents
Other elements such as the resistance of the voice coil that varies with the voice-coil temperature are also derived. The equivalent circuit for nonlinear behavior is shown in Fig. 3. The equivalent thermal circuit that describes the heating properties of the driver is shown in Fig. 4.
Hardware involved in making the measurements includes:
1. The Distortion Analyzer 1 with AD and DA converters, current and voltage sensors, and DSPs
2. An audio power amplifier
3. Cables for connecting the driver and amplifier
4. An IBM-compatible computer with USB interface
5. Analyzer and simulation software
In addition, a laser can be used to measure the displacement of the diaphragm (Photo 14).
Driver Measurement
Measurements start by mounting the driver in free air or in a sealed box, free air being preferred. A noise signal as specified in IEC 60268-1 is applied to the amplifier powering the driver under test. Part of the function of the Distortion Analyzer is to limit the drive signal to a level that represents a safe working range for the driver in terms of maximum power and displacement. There are five steps in the test:
1. All of the drive and measuring parts of the system are tested before a signal is applied to the driver under test.
2. Small signal measurements are made.
3. Operating range of the driver is determined by slowly increasing the drive signal until one of the limits of safe operating range is reached.
4. Thermal parameters are measured.
5. The learning speed of the update algorithm is reduced to minimize the effects of measurement noise on the parameter estimates. Longer term measurements are then done to monitor variations of driver parameters and thermal resistance and capacitance of the magnet structure.
Resulting data is then used to provide both small- and large-signal parameters, including nonlinear parameters and distortion analysis.
Two of the Klippel system capabilities I found particularly interesting were the ability to simulate a complete system including driver and enclosure and the ability to take the modeled behavior of a driver and pass it through a high-performance speaker system to hear the various distortion components. The two modules are called Simulation (SIM) and Auralization (AURA).
At first, SIM may sound like any of the box tuning programs available. Not so. It provides a spectral analysis of proposed combinations. Dominant nonlinearities of the driver, enclosure, and radiation are considered. For example, air compression and port noise can be considered. In addition, each nonlinearity can be switched off to examine its effect on the system.
AURA is even more fascinating. By transferring all the measured driver parameters into this module, either test signals or music can be passed through the “driver.” Actually, as the signal is passed through the module, it is modified by the nonlinearities measured for the driver.
The resulting signal is passed through a high-quality audio system to allow listening of the effects of the driver nonlinearities. A high-quality tweeter simulation fills out the test signal to provide full-range output for the listening test. As with SIM, the various nonlinearities can be removed from the “driver” to see what effect reducing those nonlinearities would have on the resulting sound. These tests can be run both as open A/B or blind comparisons.
Conclusions
I hope that you have been able to get a flavor of the depth of information that is available from these systems. Should you, as an enthusiast, rush out and buy one of them? I don’t think so, unless you plan to spend upwards of the middle five figures and also a lot of time learning and doing analyses.
More realistically, many suppliers are now starting to specify realistic XMAX values as measured by DUMAX or Klippel. If your vendor does not, you might wish to drop them a note saying they are only providing half a loaf when it comes to their data. T/S parameters are fine, but they don’t cut it under real-life drive situations. Not knowing what the driver is going to do when faced with higher-than-whisper-level signals is a severe limitation in any speaker design project.
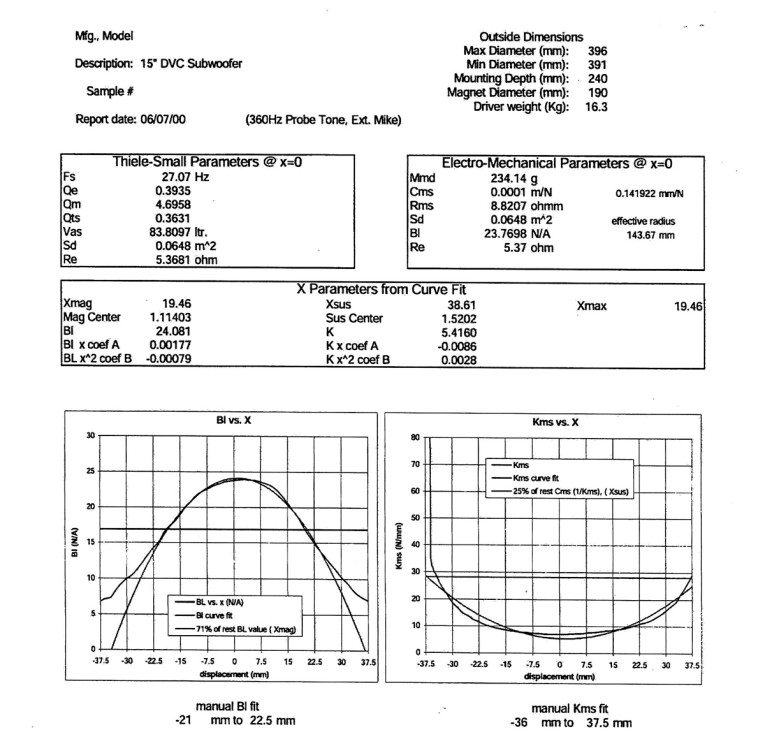
Figure 5 is an example of a basic DUMAX report on a high-quality 15" driver. As you can see from the results, this driver is limited by the length of the magnetic field rather than the linear travel of the suspension. XMAG is 19.46mm, while XSUS is 38.61mm. The resulting XMAX is 19.46mm.
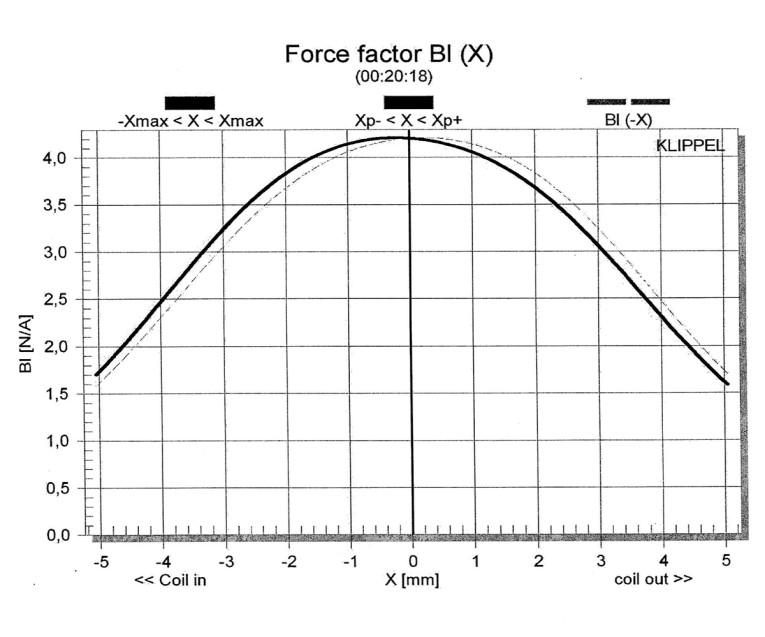
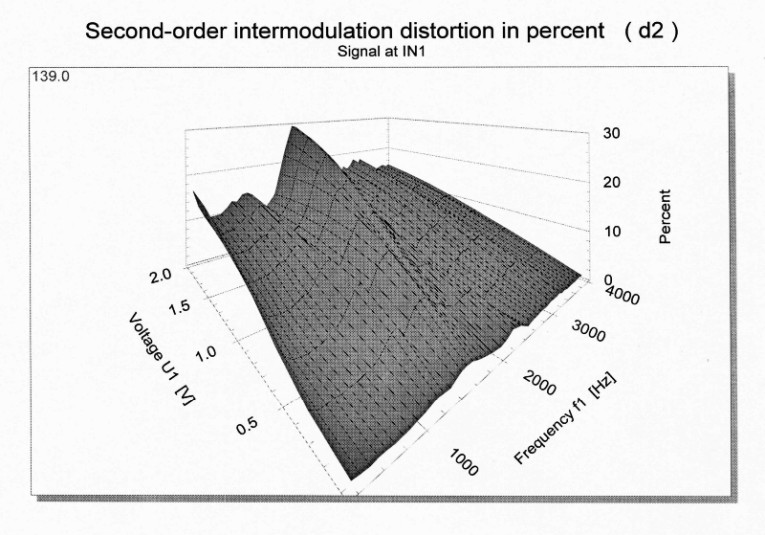
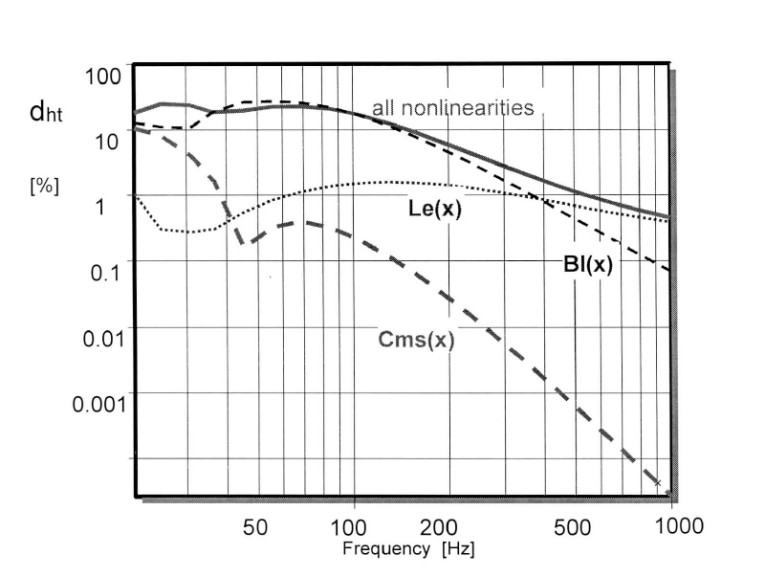
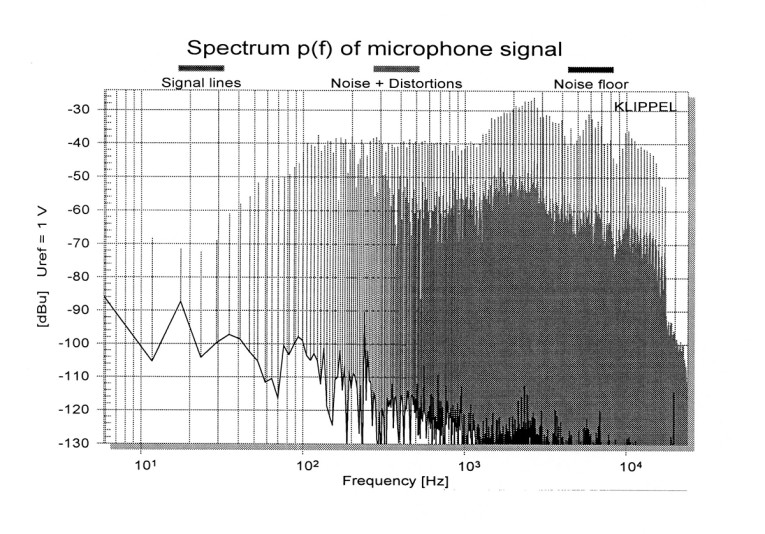
Klippel reports can vary widely due to the large number of tests that can be performed. Figures 6−8 show just a few of the results you can expect from a basic test. Three examples of some of the results obtainable from the optional modules are shown in Figs. 9−11.
The Klippel website also has a wealth of information in the form of papers and descriptive information you can download. Just reading his papers can give you a much broader understanding of how dynamic drivers work and what problems are encountered. The product information is broken down into an overview and then individual pieces on each module and the hardware.
Both of these systems have been designed by people who know how to deal with the foibles of dynamic drivers. In addition to their own work, their papers point to a great deal of reference material done by other people. My suggestion is to get through as much of the Clark and Klippel work as you can handle to give yourself a better understanding of dynamic drivers before making choices for your next project. The time will be well spent. aX
References
1 - D. Clark, “Precision Measurement Of Loudspeaker Parameters,” Journal of the Audio Eng. Soc. Vol. 5, pp. 129−141 (1997 March).
2 - W. Klippel, “Distortion Analyzer a New Tool for Assessing and Improving Electrodynamic Transduction,” presented at 111th Convention of The Audio Eng. Soc., February 19−22, 2000, Paris, France, preprint 5109.
DLC Design: Website no longer available
Klippel Gmbh: www.klippel.de
This article was originally published in audioXpress, March 2003. Klippel test and measurement systems referenced in this article continue to evolve - hardware and software.