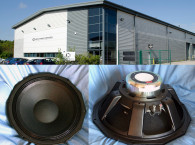
Paul Niedermann, CEO & Founder, didn’t like giving up trunk space for the premium large loudspeaker system included in his vehicle purchase. And for all the space the system assumed, the sound quality wasn’t great. Always the innovator, with a keen ability to rethink a product and its technology, Niedermann set out to create a new driver.
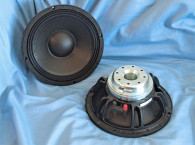
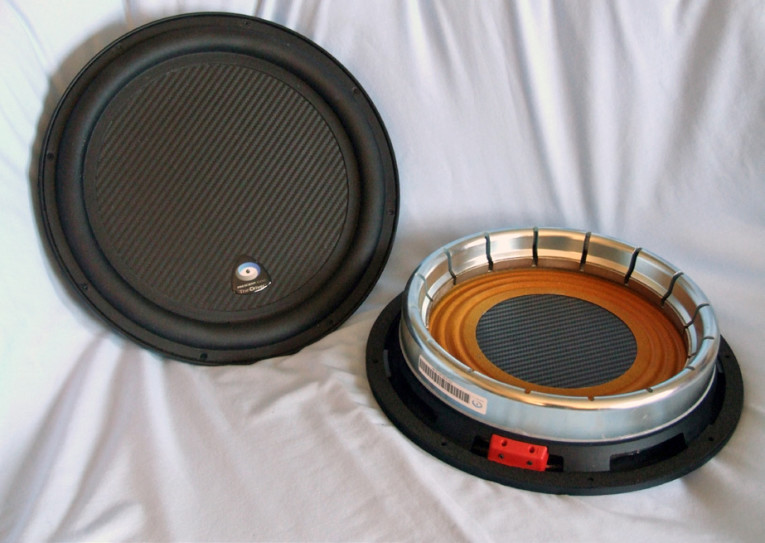
From his first design in 2008 and the initial prototype in 2010, Niedermann’s development and refinement since then has resulted in the highly anticipated ThinDriver technology.” When Prescient Audio talks about the “ThinDriver,” it is describing the subject of this review, the TD-12 12” subwoofer (see Photo 1). The TD-12 has a physical mounting depth of only 2.25” to the bottom of the frame (2.68” to the top of frame).
The TD-12 has a unique and interesting feature set that starts with an extremely shallow 35-mm depth proprietary eight-spoke cast aluminum frame. Other features include a stiff flat 12” cone that uses a carbon fiber surface sandwiched with a polyurethane composite formulation that is stiff and light, an injection-molded Santoprene surround, and a 9” diameter flat poly cotton spider. All this is driven by a 250-mm diameter (9.85”) voice coil wound with flat copper-clad aluminum wire (CCAW) parallel wound (with flat side of the wire against the former) on a Kapton former. The motor system powering the cone assembly utilizes a large CNC steel poleless return device that holds a series of 16 neodymium curved bar magnets that each measure approximately 37 mm × 15 mm × 10 mm glued to the magnetic field return device. The braided voice coil lead wires terminate to a pair of set screw-type terminals that accepts up to 14-gauge wire.
I began characterizing the new TD-12 using the LinearX LMS analyzer and VIBox. I generated the voltage and admittance (current) measurements in free air at 0.3, 1, 3, 6, 10, 15, 20, and 30 V. I used the measured Mmd (an actual physical cone assembly measurement with 50% of the surround and spider removed) that was provided by Prescient Audio rather than a single 1 V added (delta) mass measurement. It should also be noted that this multi-voltage parameter test procedure includes heating the voice coil between sweeps for progressively longer periods to simulate operating temperatures at that voltage level (raising the temperature to the third time constant).
I did not use the 30-V curves as the driver was getting sufficiently nonlinear and LEAP 5 was unable to get a satisfactory curve fit. I further processed the remaining 14 sine wave sweeps with the voltage curves divided by the current curves to produce impedance curves. I used the LEAP phase calculation routine to generate the phase curves. Then, I copy/pasted the impedance magnitude and phase curves plus the associated voltage curves into the LEAP 5 software’s Guide Curve library.
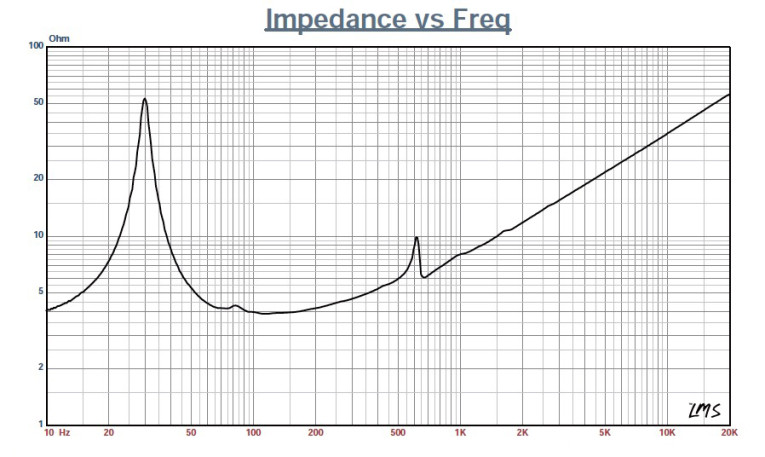
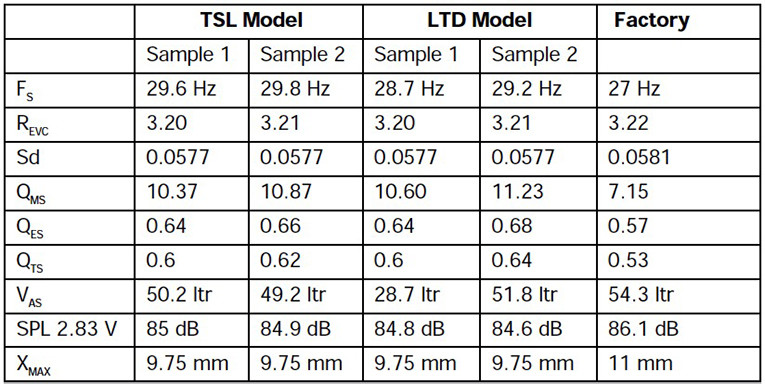
With this data, I calculated the parameters using the LEAP 5 LTD transducer model. Because most manufacturing data is produced using either a standard transducer model or the LEAP 4 TSL model, I also generated LEAP 4 TSL model parameters using the 1 V free air. Figure 1 shows the TD-12’s 1 V free-air impedance plot. Table 1 compares the LEAP 5 LTD and LEAP 4 TSL T-S parameter sets for the TD-12 samples along with the Prescient Audio factory data.
From the comparative data shown in Table 1, all four parameter sets for the two samples were consistent and correlated fairly well with the factory data. Following my normal protocol for Test Bench testing, I used the Sample 1 LEAP 5 LTD parameters and set up two computer box simulations, one in a 1.75 ft3 Qtc = 1 type sealed enclosure with 50% fill material (fiberglass) and a second vented box Chebychev/Butterworth alignment in a 3.8-ft3 box with 15% fill material and tuned to 21 Hz.
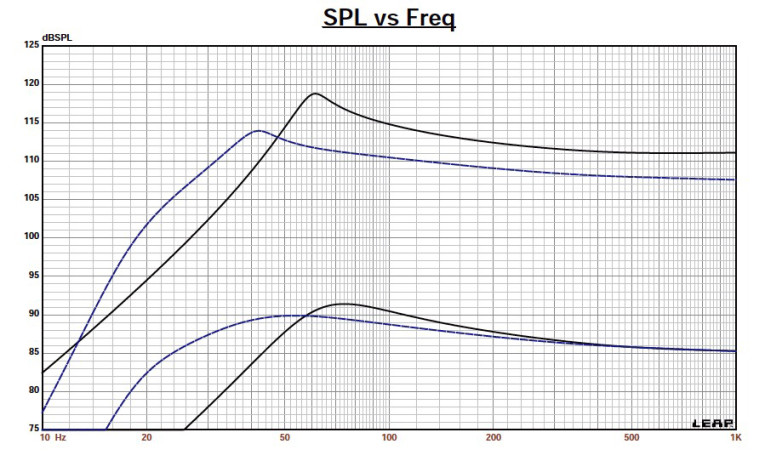
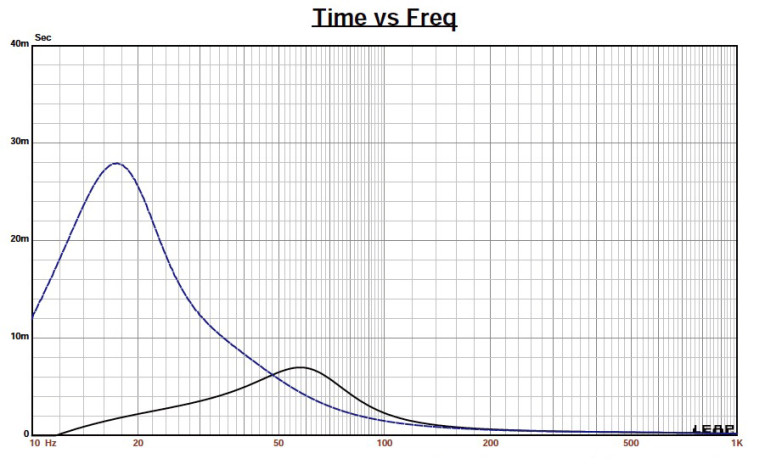
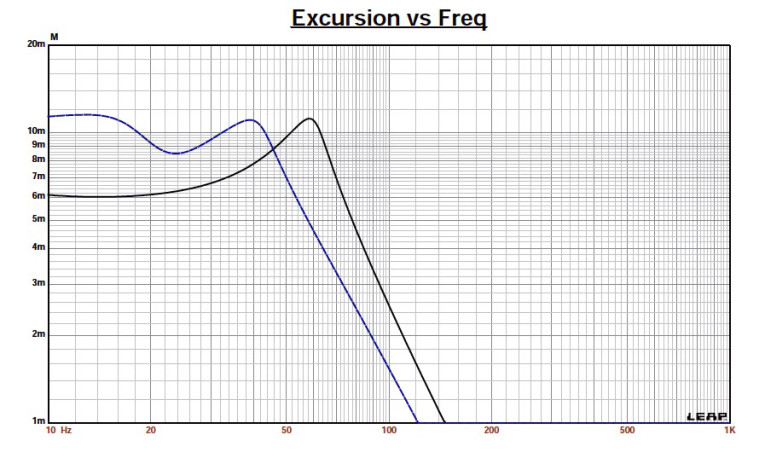
Figure 2 shows the TD-12’s results in the sealed and vented enclosures at 2.83 V and at a voltage level high enough to increase the cone excursion to 12 mm (XMAX + 15%). This resulted in a F3 of 52 Hz (–6 dB = 44 Hz) with Qtc = 1 for the 0.56-ft3 closed box and a –3 dB for the Chebychev/Butterworth vented simulation of 28 Hz (–6 dB = 22 Hz).
Increasing the voltage input to the simulations until the approximate XMAX + 15% maximum linear cone excursion point was reached resulted in 119 dB at 67 V for the sealed enclosure simulation and 114 dB with a 41-V input level for the larger vented box. Figure 3 shows the 2.83-V group delay curves and Figure 4 shows the 67 V/44-V excursion curves.
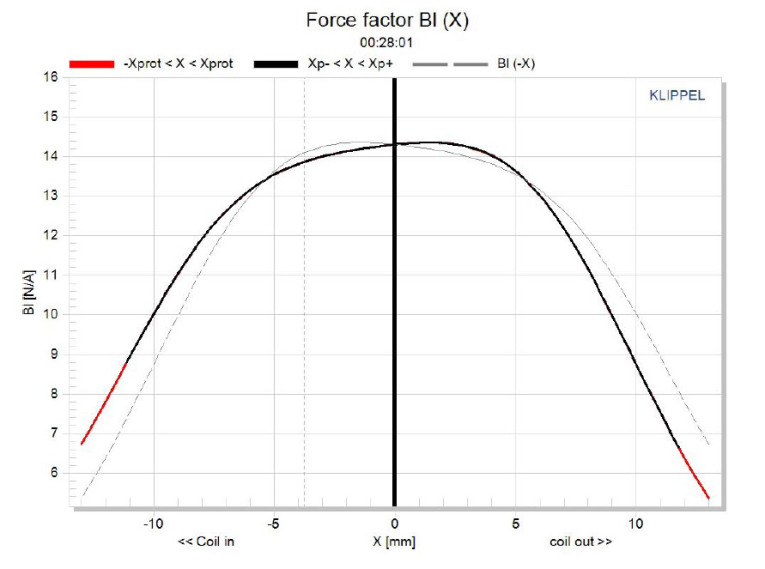
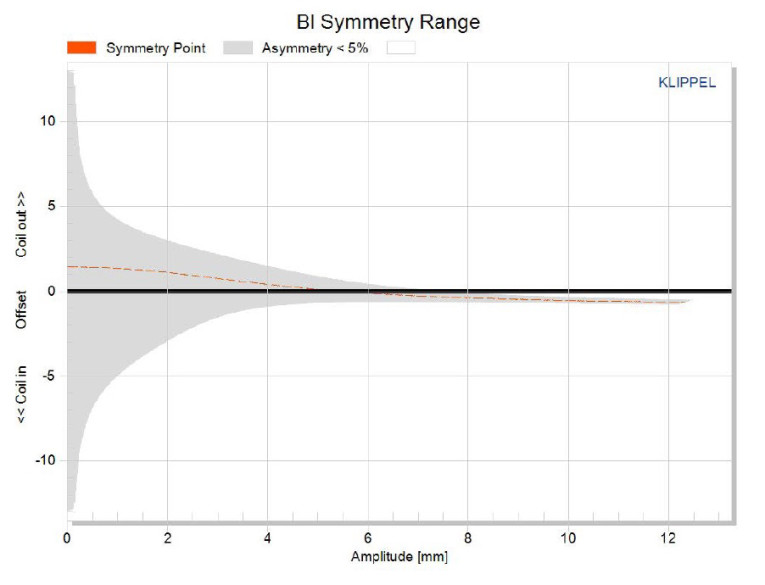
The TD-12’s Klippel analysis produced the Klippel data graphs shown in Figures 5–8. The TD-12’s Bl(X) curve, shown in Figure 5, is broad and symmetrical (with a slight tilt), which is typical of a driver with substantial XMAX. The Bl Symmetry curve, shown in Figure 6, has a trivial 0.4 mm Bl coil out (forward) offset at 4 mm of excursion (where the data is more certain), which transitions to a near zero offset at the driver’s physical XMAX.
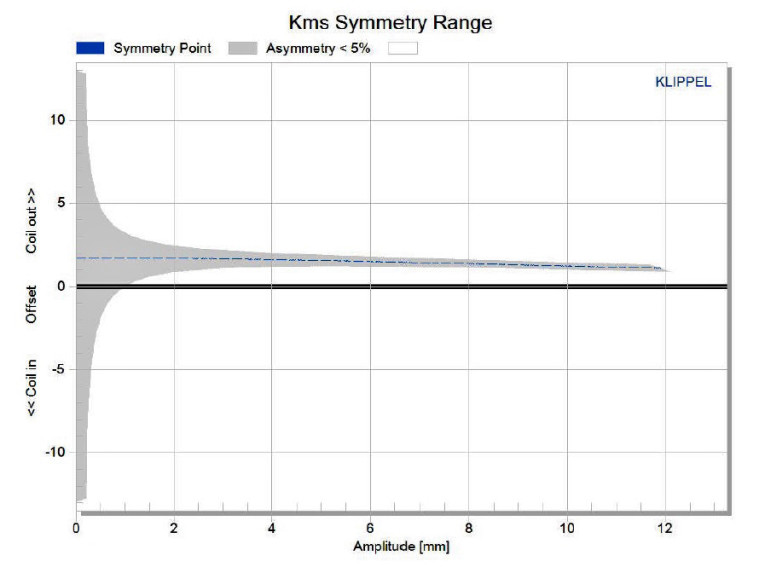
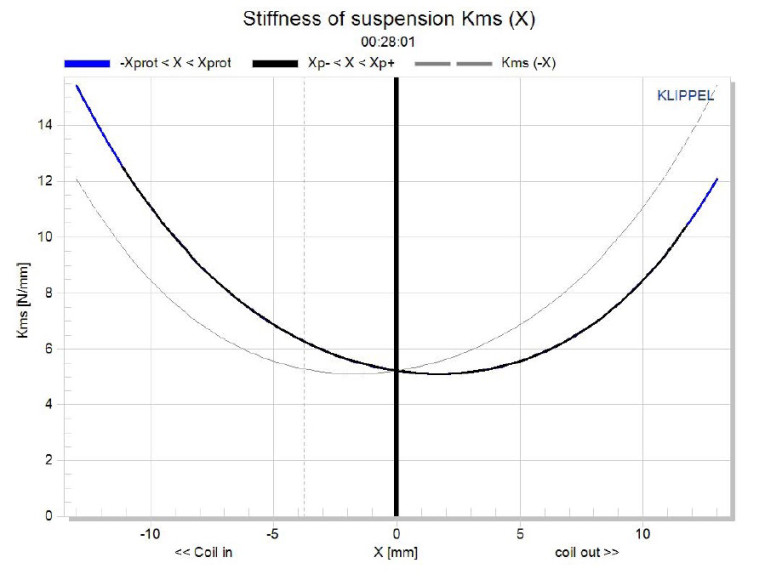
Figure 7 shows TD-12’s the KMS(X) curve. Figure 8 shows the KMS symmetry curve. Like the Bl curve, the KMS stiffness of compliance curve is very symmetrical, with only a minor offset. The KMS symmetry range curve has a minor 1.45 mm coil-out offset at the driver’s physical XMAX. The TD-12’s displacement limiting numbers, which were calculated by the Klippel analyzer using the woofer criteria for Bl, was XBl at 70% (Bl dropping to 70% of its maximum value) equal to 9 mm (somewhat less than the physical 9.75 mm XMAX for this driver) for the prescribed 20% distortion level (the criterion for subwoofers).
For compliance, crossover at 50% CMS minimum was 9.4 mm (0.35 mm less than the driver’s physical XMAX). For the TD-12, the Bl is the somewhat more limiting factor for getting to the 20% distortion level.
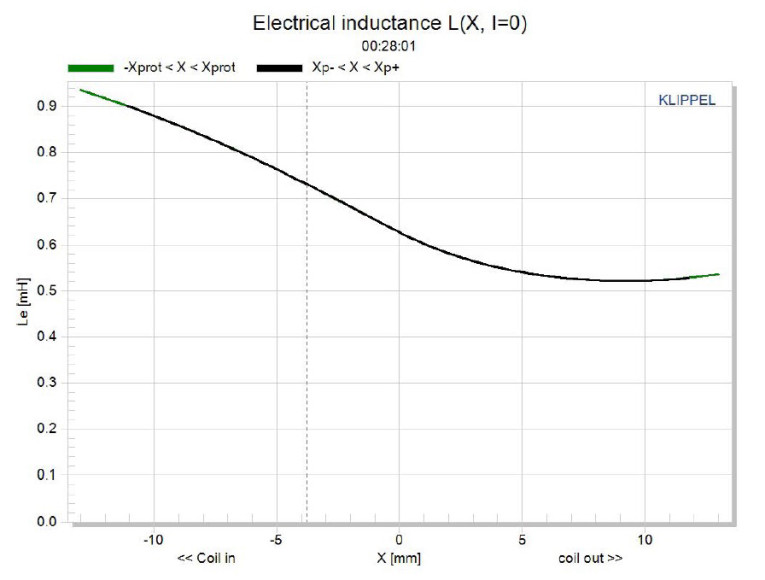
Figure 9 shows the TD-12’s inductance curve Le(X). Motor inductance will typically increase in the rear direction from the zero rest position and decrease in the forward direction as the voice coil moves out of the gap and has less pole coverage, which is what you see with this motor. However, given the TD-12’s unusual motor configuration that would not be relevant and is a design affectation. What we do get is an inductance swing from XMAXIN to XMAXOUT of only 0.35 mH, which is quite good.
Given that the TD-12 is a flat cone subwoofer, I dispensed with the SPL measurements. I also dispensed with the time-frequency analysis as the data is not really significant below 100 Hz for subwoofers. So, I used the Listen SoundCheck analyzer to perform distortion analysis.
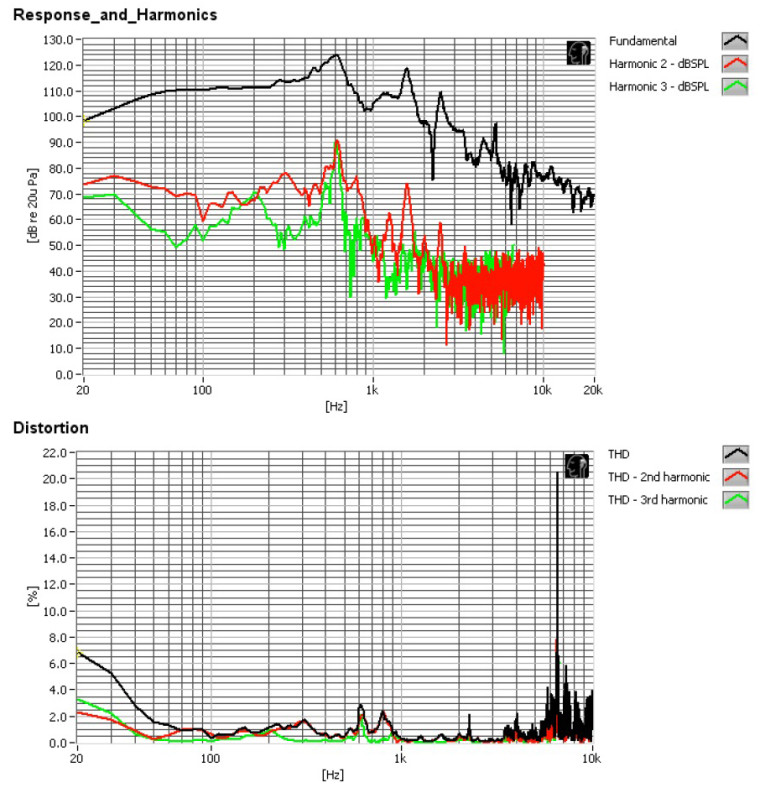
For the distortion measurements, I securely mounted the TD-12 on a stand in free air and set the voltage level. I increased the voltage drive until it produced a 1 m SPL of 94 dB (7.2 V) (my SPL standard for home audio drivers). I took the distortion measurement with the microphone placed near-field (10 cm) and the woofer mounted in the enclosure (see Figure 10). This actually includes two plots, the top graph is the standard fundamental SPL curve with the second and third harmonic curves.
The bottom graph is the second and third harmonic curves plus the total harmonic distortion (THD) curve with an appropriate X-axis scale. Interpreting the subjective value of conventional distortion curves is almost impossible. However, looking at the relationship of the second to third harmonic distortion curves is of value. This is a well-crafted driver with solid performance, especially considering the performance comes from a driver that is barely 2.5” deep.
For more information, visit www.prescientaudio.com.
This article was originally published in Voice Coil, August 2015.