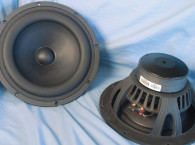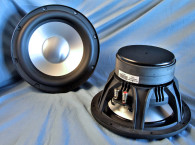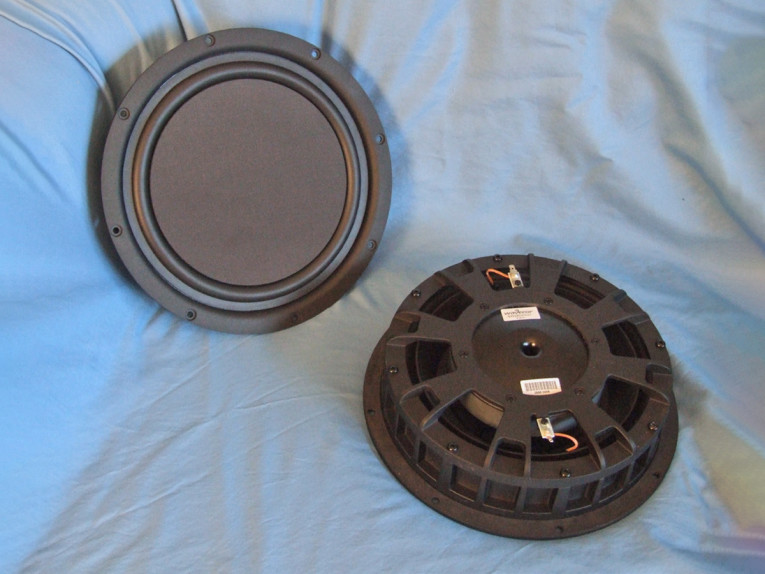

The SW280WA01 has a unique and interesting feature set that starts with an extremely shallow 76 mm (3”) depth proprietary eight-spoke vented cast-aluminum frame, as seen in Photo 1. If inset mounted into a 0.75” MDF baffle, the driver would only protrude into the enclosure by about 2.45”! Other features include the incorporation of a flat glass fiber/PMI foam sandwich cone, a dual surround no-spider suspension (see Photo 2 for a look at the inner surround), along with an innovative dual-cone design that facilitates mounting the motor structure inside the frame.
The cone is driven by a 39 mm diameter voice coil using a vented fiber glass former wound with round copper wire. Wavecor also incorporated its “balanced drive” motor configuration that features an extended and shaped pole piece as well as an aluminum shorting ring (Faraday shield). Motor parts have a black emissive coating for enhanced cooling, along with a dual flared 10 mm diameter pole vent. Last, the voice coil is terminated to gold terminals located on opposite sides of the frame to discourage rocking modes.
I began characterizing the new SW280WA01 with the LinearX LMS analyzer and VIBox. Both voltage and admittance (current) measurements were generated in free-air at 0.3 V, 1 V, 3 V, 6 V, 10 V, 15 V, and 20 V. The measured Mmd that was provided by Wavecor (an actual physical cone assembly measurement with 50% of the surround and spider removed) was used rather than a single 1 V added (delta) mass measurement. It should also be noted that this multi-voltage parameter test procedure includes heating the voice coil between sweeps for progressively longer periods to simulate operating temperatures at that voltage level (raising the temperature to the third time constant).
I further processed the remaining 14 sine wave sweeps for each woofer and divided the voltage curves by the current curves to produce impedance curves. I generated the phase curves using the LEAP phase calculation routine. I copy/pasted the impedance magnitude and phase curves plus the associated voltage curves into the LEAP 5 software’s Guide Curve library. I then used this data to calculate the parameters using the LEAP 5 LTD transducer model.
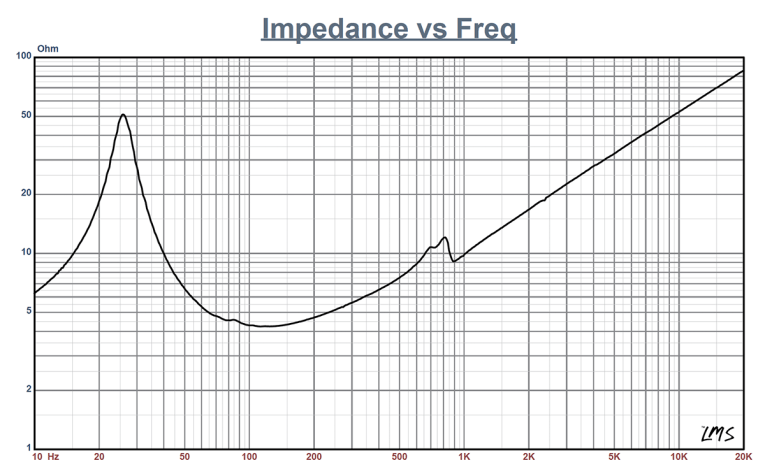
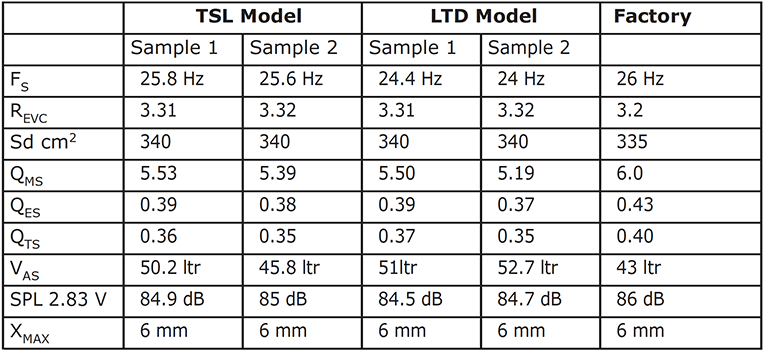
Because most all of the manufacturing data is produced using either a standard transducer model or in many cases the LEAP 4 TSL model, I also generated LEAP 4 TSL model parameters using the 1 V free-air that can also be compared with the manufacturer’s data. Figure 1 shows the 1 V free-air impedance plot. Table 1 compares the LEAP 5 LTD and LEAP 4 TSL T-S parameter sets for the SW280WA01 samples along with the Wavecor factory data.
From the comparative data shown in Table 1, you can see that all four parameter sets for the two samples were very consistent and correlated fairly well with the factory data. Following my normal protocol for Test Bench testing, I used the sample 1 LEAP 5 LTD parameters and set up two computer box simulations — one in a 0.58 ft3 Butterworth-type sealed enclosure with 50% fill material (fiberglass) and a second vented box QB3 alignment in a 0.94 ft3 box with 15% fill material and tuned to 26.3 Hz.

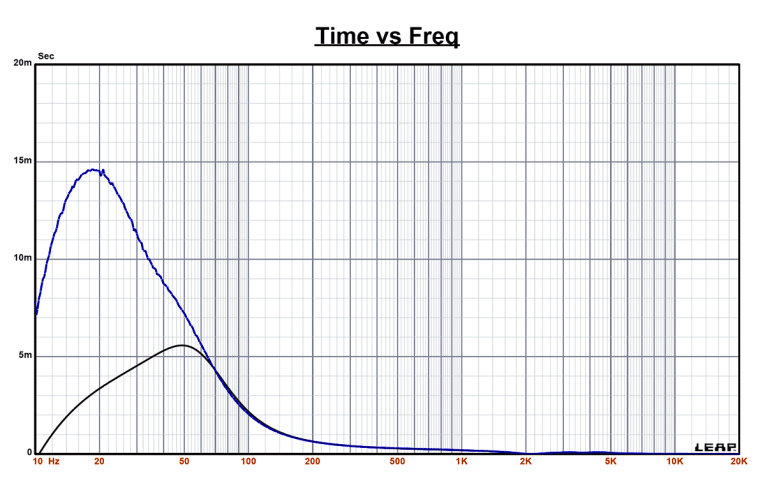
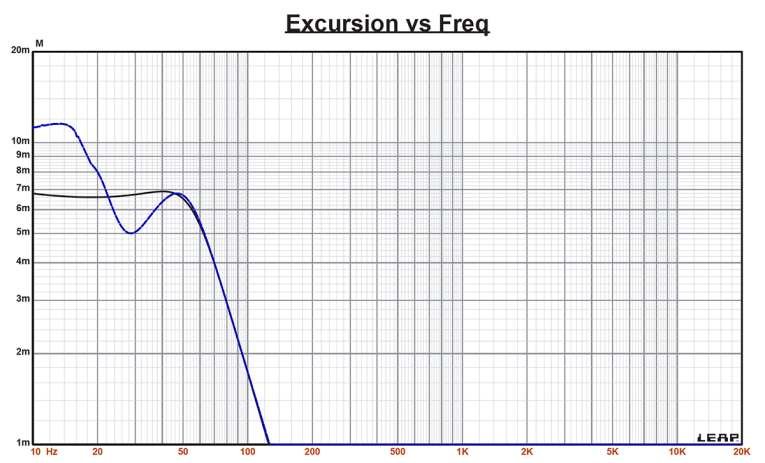
Figure 2 gives the results for the SW280WA01 in the sealed and vented enclosures at 2.83 V and at a voltage level sufficiently high enough to increase cone excursion to Xmax + 15% (6.9 mm). This resulted in a F3 of 48 Hz (-6 dB = 39 Hz) with a Qtc = 0.68 for the 0.56 ft3 closed box and a -3 dB for the QB3 vented simulation of 39.5 Hz (-6 dB = 32 Hz). Increasing the voltage input to the simulations until the approximate Xmax +15% maximum linear cone excursion point was reached resulted in 108 dB at 30 V for the sealed enclosure simulation and 109.5 dB with a 32.5 V input level for the larger vented box. Figure 3 shows the 2.83 V group delay curves. Figure 4 shows the 30 V/32.5 V excursion curves.
Klippel analysis for the SW280WA01 produced the Klippel data graphs shown in Figures 5-8. (Please note that if you do not own a Klippel analyzer and would like this type of data on any transducer, Redrock Acoustics can provide Klippel analysis of most any driver. For more information, visit www.redrockacoustics.com).
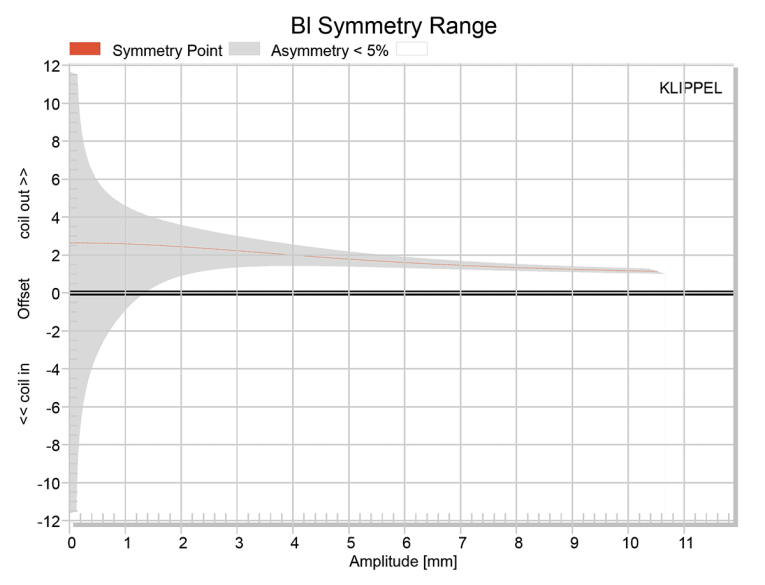
The Bl(X) curve for SW280WA01 (Figure 5) is fairly broad with a degree of tilt and asymmetry. Looking at the Bl symmetry curve (Figure 6), you can see a coil-out offset at 3 mm of excursion of about 2.24 mm, but this decreases to 1.7 mm at the driver’s physical Xmax.
Figure 7 shows the Kms(X) symmetry curves and Figure 8 shows the Kms symmetry range curves. The Kms stiffness of compliance curve (Figure 7) is very symmetrical, with only very minimal coil-out offset. The Kms symmetry range curve has a minor 1.45 mm coil-out offset at the 6 mm physical Xmax of the driver.


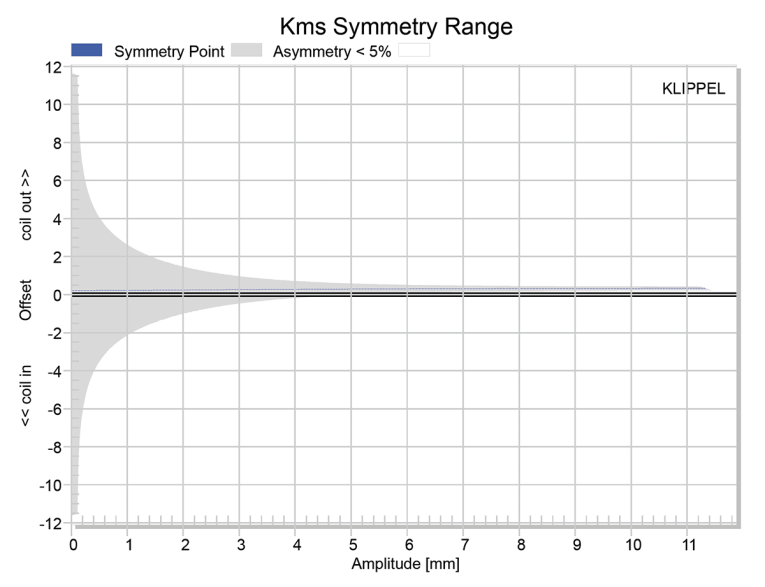
Displacement limiting numbers calculated by the Klippel analyzer for the SW280WA01 using the 70/50 subwoofer criteria for Bl was XBl at 70% (Bl dropping to 70% of its maximum value) equal to 6.5 mm (somewhat beyond the physical 6.0 mm Xmax for this driver) for the prescribed 20% distortion level. For the compliance, XC at 50% Cms minimum was 8.6 mm, which means that for the Wavecor SW280WA01, the Bl is the more limiting factor for getting to the 20% distortion level.
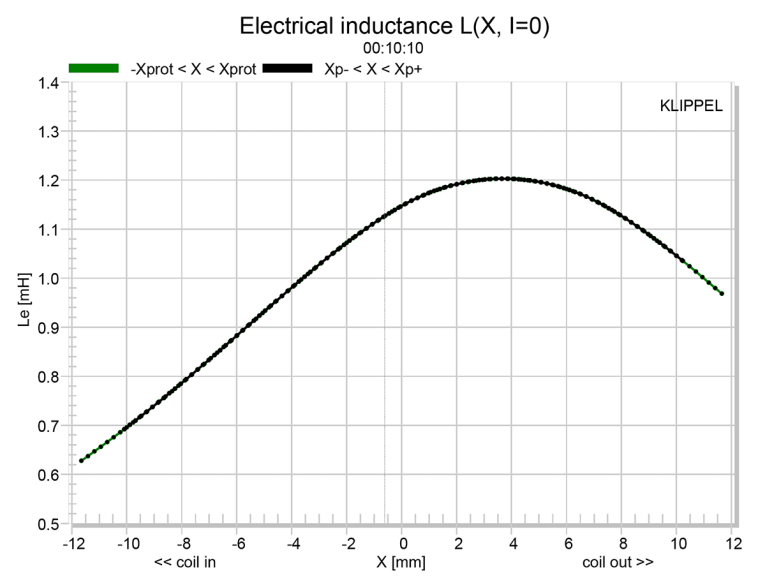
Figure 9 shows the inductance curve L(X) for the SW280WA01. Motor inductance will typically increase in the rear direction from the zero rest position and decrease in the forward direction as the voice coil moves out of the gap and has less pole coverage, but that doesn’t happen with this motor due to the effectiveness of the aluminum shorting ring. What we also get is an inductance swing from Xmax in to Xmax of 0.013 mH to 0.26 mH, which is quite good.
Given that the SW280WA01 is a flat cone subwoofer, I dispensed with the SPL measurements since this driver will not likely be crossed over much over 100 Hz. (Wavecor posts the frequency response curve for the SW280WA01 on its website, if you are interested.) I also dispensed with the time-frequency analysis as the data is not really significant below 100 Hz.
Given that, I commenced the last phase of testing using the Listen SoundCheck analyzer to perform distortion analysis. For distortion measurements, I set the voltage level with the driver securely mounted on a stand in free-air and increased the voltage drive until it produced an 1 m SPL of 94 dB (my SPL standard for home audio drivers), which occurred at 11.8 V. I then made the distortion measurement with the microphone placed near-field (10 cm), with the woofer mounted in the enclosure.
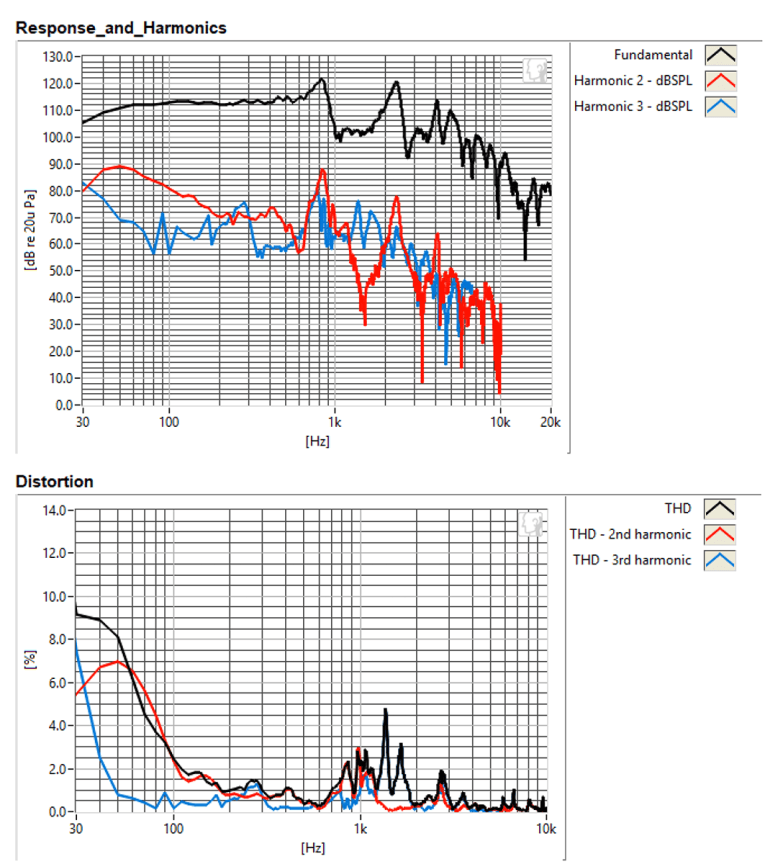
This plot is shown in Figure 10, which actually includes two plots—the top graph being the standard fundamental SPL curve with the second and third harmonic curves, and the bottom graph the second and third harmonic curves, plus the THD curve with an appropriate X-axis scale. Interpreting the subjective value of conventional distortion curves is almost impossible; however, looking at the relationship of the second to third harmonic distortion curves is of value.
As can be inferred from the data, this is a well-crafted driver with solid performance, especially considering the feat of getting that performance out of driver barely 3” deep. For more information, visit www.wavecor.com. VC
This article was originally published in Voice Coil, June 2019.
Check also the interview with Allan Isaksen at the 2019 High End show in Munich, precisely discussing this new range of shallow subwoofers from Wavecor: https://www.audioxpress.com/article/new-shallow-subwoofers-from-wavecor-discussing-high-end-and-custom-development