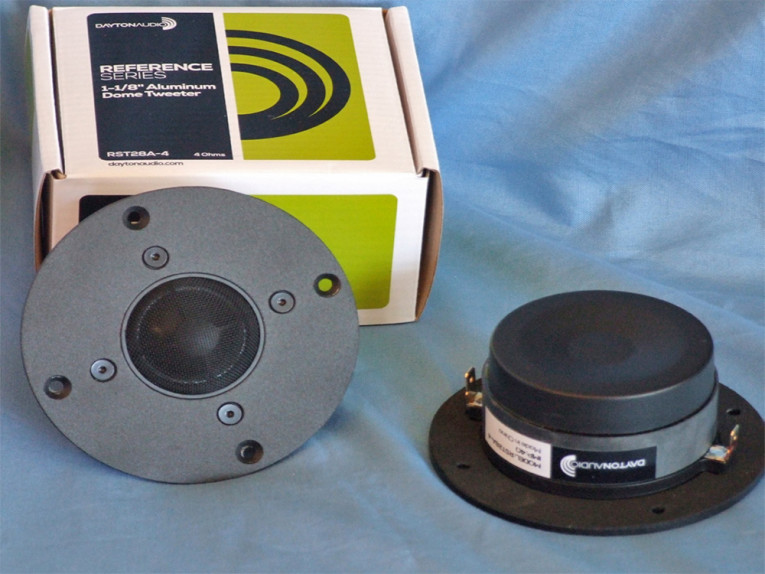


Features in common include a 4 Ω voice coil, a ferrite magnet motor structure, an aluminum faceplate, a tuned injection-molded rear cavity, low viscosity ferrofluid in the gap area, a phase diffuser with a protective screen, 50 W RMS power handling, replaceable diaphragms, and gold-plated terminals.
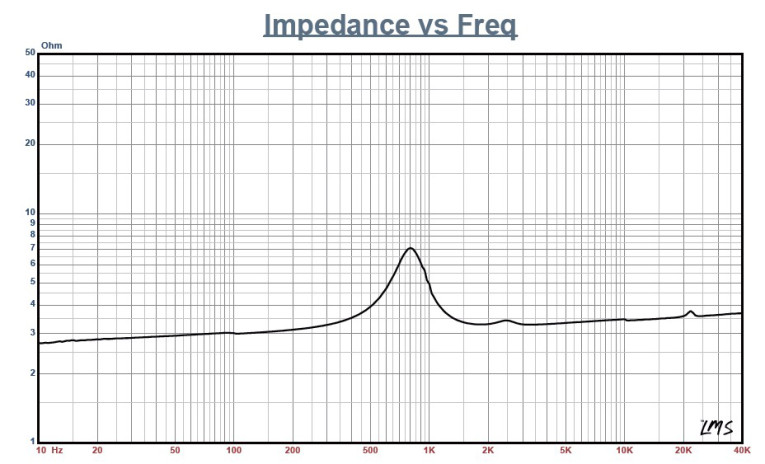
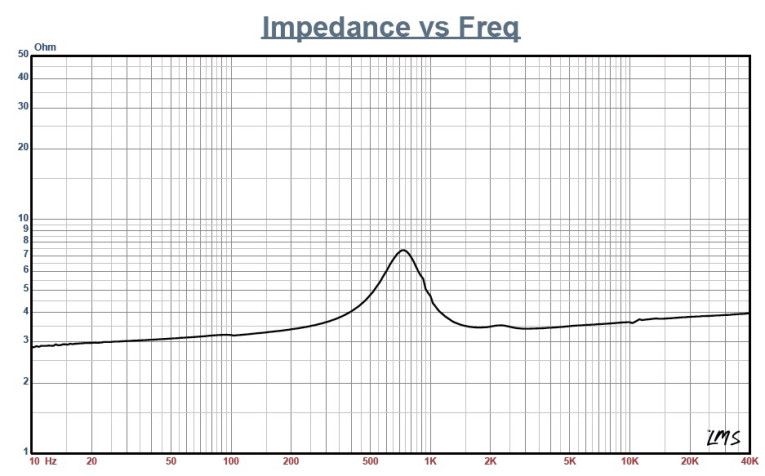
To begin, I used the LinearX LMS analyzer to produce the 300-point impedance sweep illustrated in Figure 1. The RST28A-4’s impedance resonance occurs at a moderately low 800 Hz (factory spec is 775 Hz). With a 32.99 Ω DCR (Re) (factory spec is 3 Ω), with the minimum impedance for this tweeter measuring 3.29 Ω at 3.48 kHz.
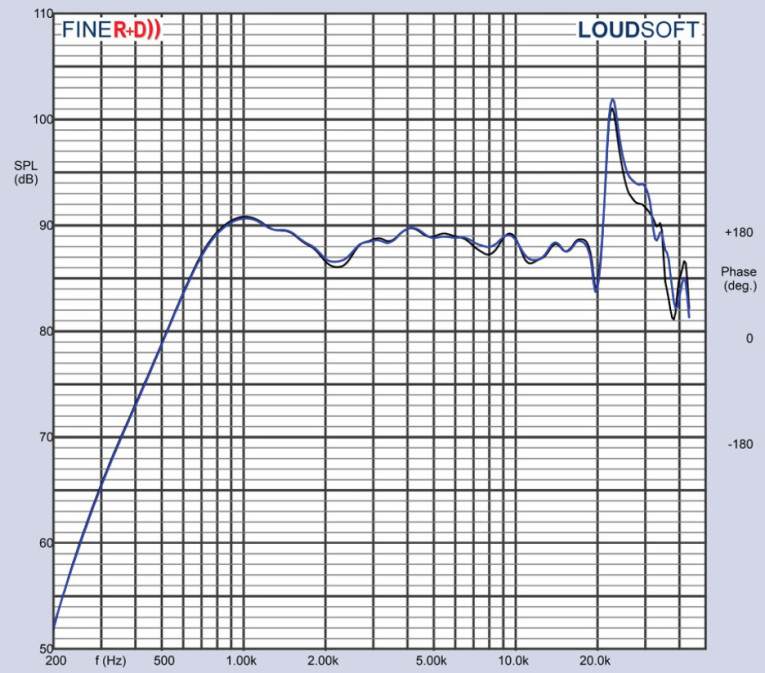
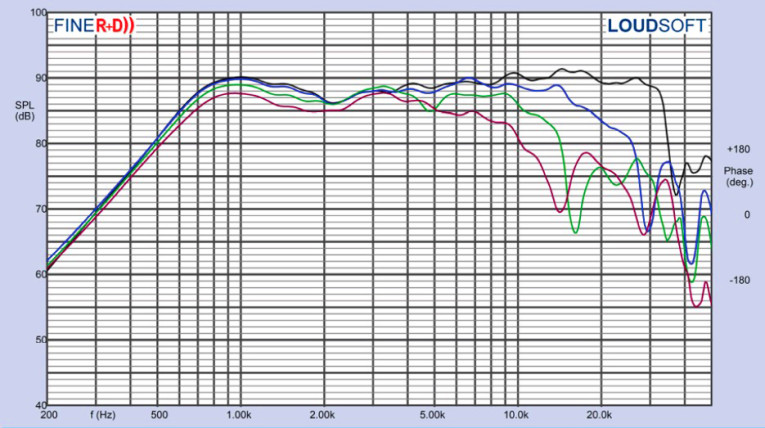
After completing the impedance testing, I recess mounted the RST28A-4 in an enclosure that had a baffle area of 17” × 8” and measured the on- and off-axis frequency response with a 1/6 octave smooth cosine windowed FFT at 2.83 V/1 m, using FINE R+D and the G.R.A.S 46 BE microphone.
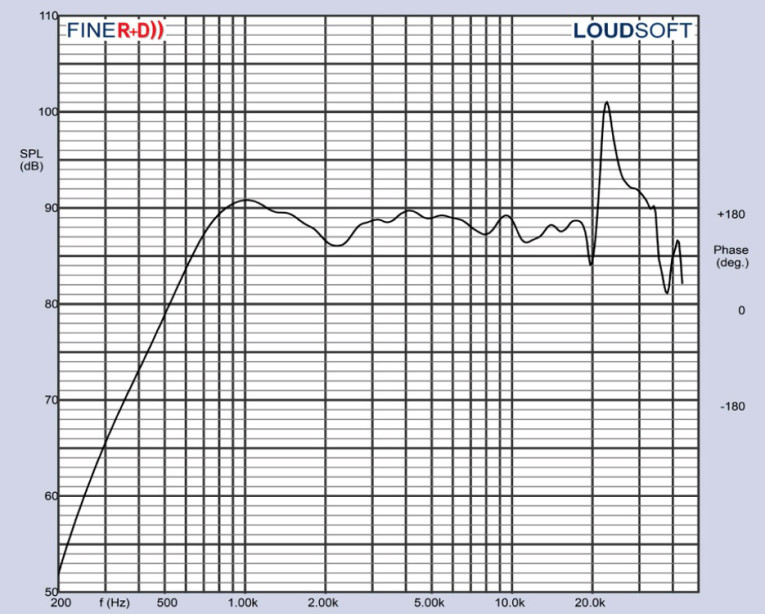
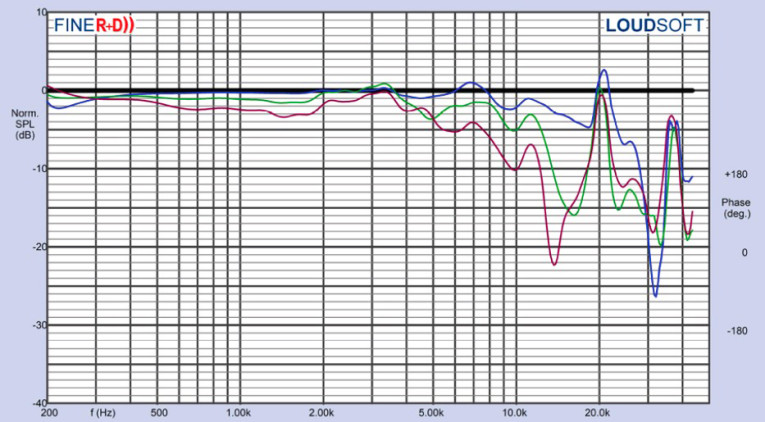
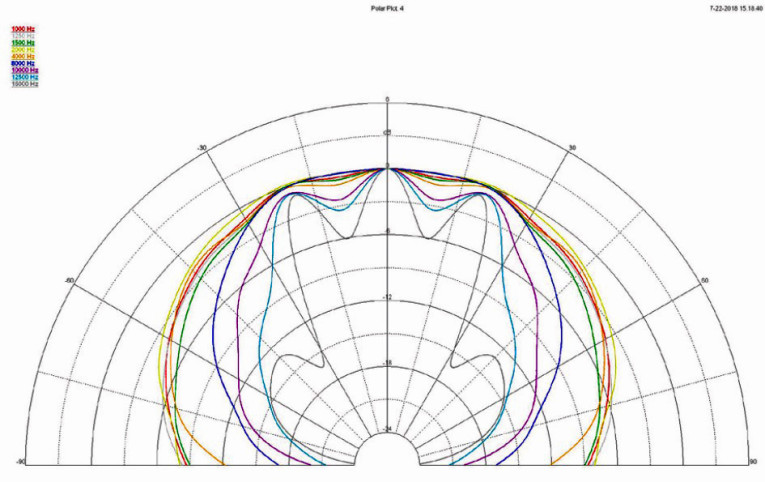
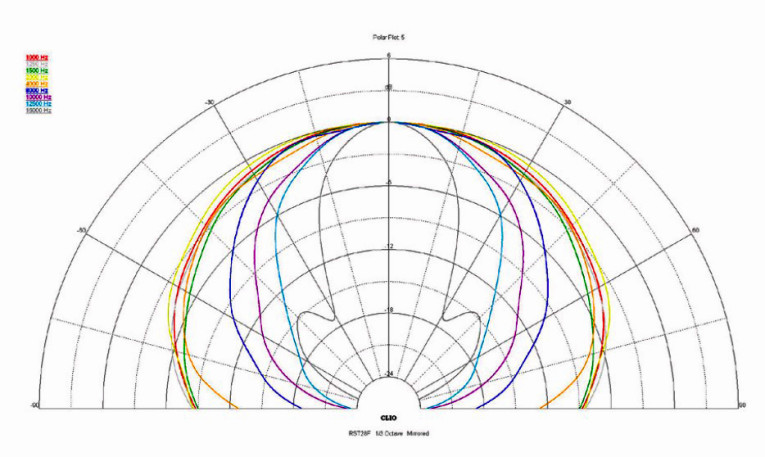
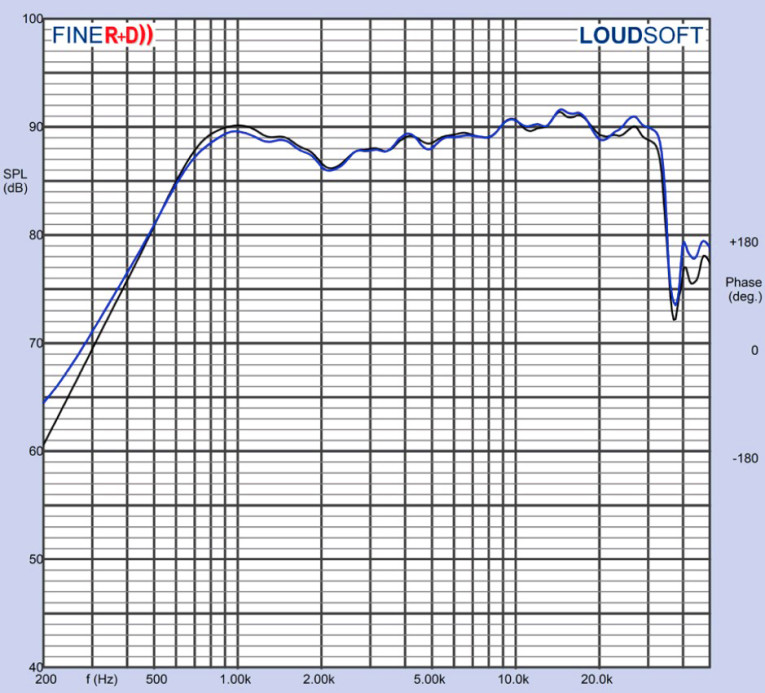
Figure 2 shows the RST28A-4 on-axis response to be a flat ±2 dB from 1.2 kHz to 19 kHz, with the aluminum diaphragm breakup mode centered on 22 kHz. Figure 3 gives the on- and off-axis response of the RST28A-4, with the off-axis curves normalized to the on-axis response in Figure 4. Figure 5 shows the CLIO 180° polar plot (measured in 10° increments). The two-sample SPL comparison is illustrated in Figure 6, indicating the two samples were closely matched to within 1 dB throughout its operating range.

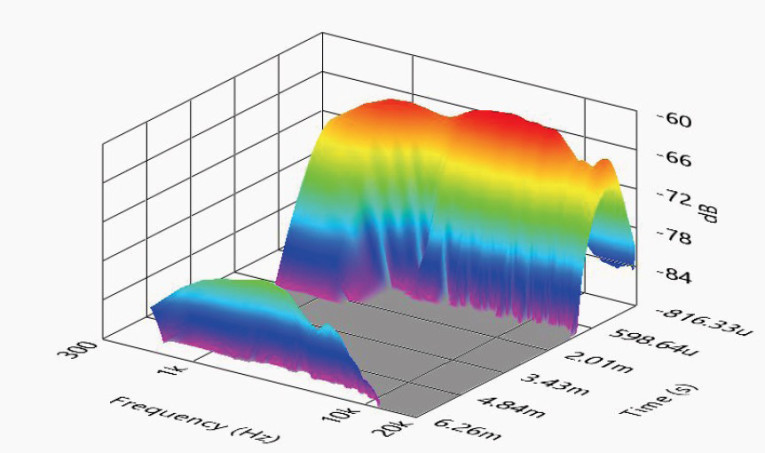
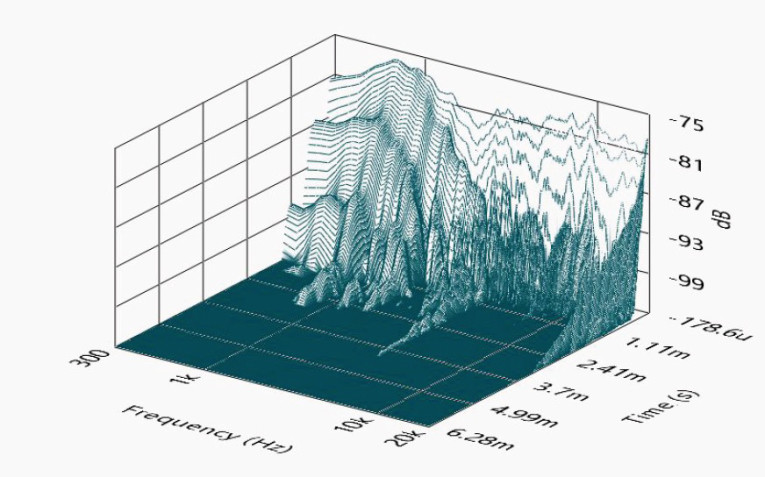
The next test procedure was to initiate the Listen AudioConnect analyzer along with the Listen SCM 1/4” microphone, using SoundCheck 16, to measure the impulse response with the RST28A-4 recess mounted on the same test baffle previously used. Importing the impulse response into the Listen SoundMap software resulted in the CSD waterfall plot shown in Figure 7. With Figure 8, I used the same data to produce the Short Time Fourier Transform (STFT) displayed as a surface plot.
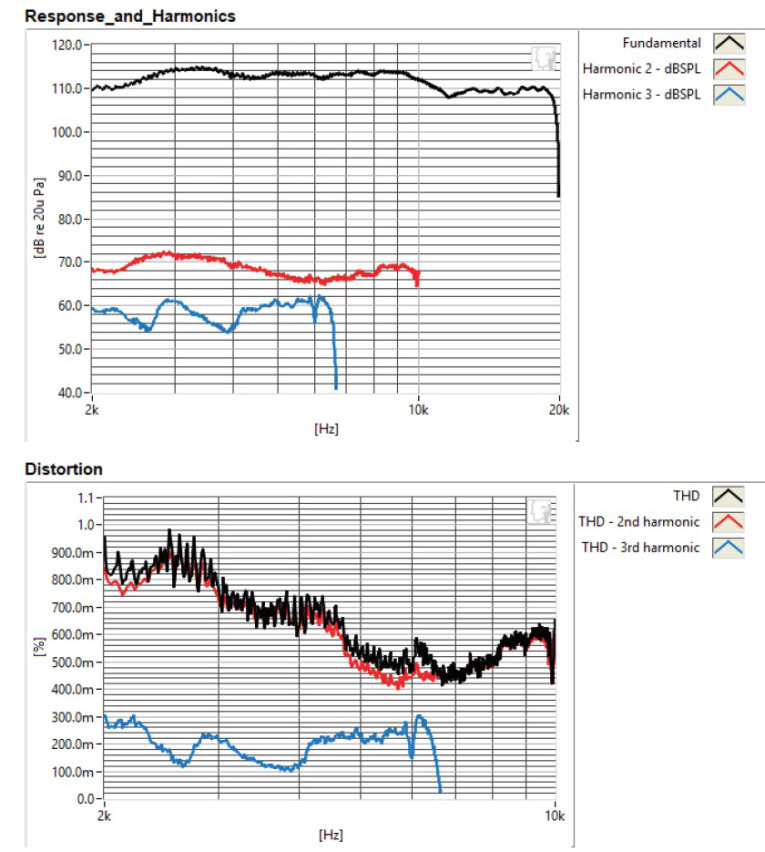
For the last objective test, I set the SPL to 94 dB (4.82 V) using a pink noise stimulus (SoundCheck has a built in generator and SLM utilities for this purpose), and measured the second (red curve) and the third (blue curve) harmonic distortion at 10 cm, depicted in Figure 9.
The RST28F-4
I began analysis for the silk dome version of the RST28A-4, the RST28F-4, by performing a 300-point LMS impedance curve depicted in Figure 10. The impedance resonance for this tweeter occurs at a moderately low 737 Hz (factory spec is 710 Hz). With a 2.87 Ω DCR (Re) (factory spec is 3 Ω), with the minimum impedance for this tweeter measuring 3.42 Ω at 3.03 kHz.


Next, I mounted the RST28F-4 in an enclosure with a 17” × 8" baffle area and proceeded to measure the on- and off-axis SPL. The FINE R+D analyzer and G.R.A.S. 46 BE mic was set up to measure the 200 Hz to 40 kHz frequency response curve. Data was then taken with sweeps at 0°, 15°, 30°, and 45°. Figure 11 shows the on-axis response of the RST28F-4. The RST28F-4’s frequency response is ±2.5 dB from 1,000 Hz to 14.9 kHz, with no major breakup modes apparent, and a response out to 30 kHz.
Figure 12 depicts the on- and off-axis frequency response in the horizontal plane. Figure 13 shows the off-axis curves normalized to the on-axis response. Figure 14 shows the CLIO 180° polar plot (measured in 10° increments). The two-sample SPL comparison is illustrated in Figure 15, indicating the two samples were closely matched to within 0.5 dB to 1 dB throughout its operating range.

For the last group of measurements, I again set up the Listen SoundCheck analyzer with the SCM microphone and AudioConnect preamp/power supply. With the SPL set to 94 dB/1 m (4.31 V) using the built in pink noise generator and SLM utilities, I relocated the 1/4” SCM microphone to 10 cm from the RST28F-4 silk dome’s faceplate and ran the distortion curves depicted in Figure 16 (red curve = second harmonic, blue curve = third harmonic).
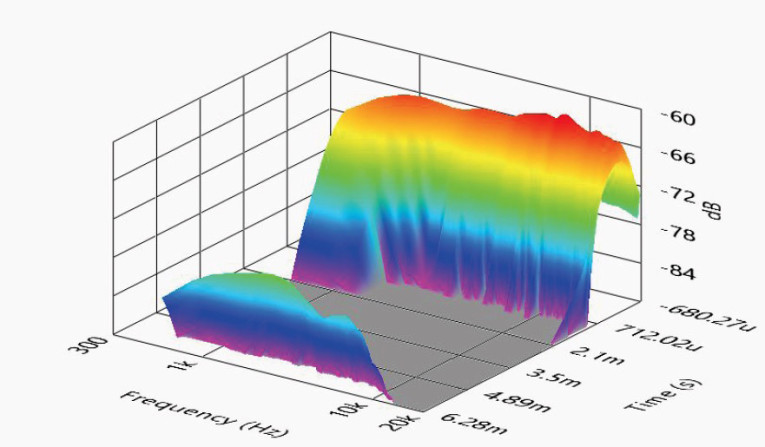
For the final measurement on the Dayton RST28F-4 silk dome tweeter, I performed an impulse measurement and imported the data into the Listen SoundMap software, windowed out the room reflections, and created the CSD plot shown in Figure 17 and the STFT shown in Figure 18.
As can be seen from the objective data, Dayton Audio did a nice job with these two ferrite motor tweeters. For more information on these and other transducers, visit www.daytonaudio.com. VC
This article was originally published in Voice Coil, September 2018.