To start, we need to determine the ideal measurement cycle for a loudspeaker. Typically, we set up the software, adjust the levels, hit “Go,” and the measurement appears. That’s nice and simple in theory, and simple in reality if you are a dedicated speaker guy who doesn’t fuss much with anything else and can leave things set up.
I look with envy on the photos from folks such as Joe D‘Appolito, who have dedicated speaker labs or those who can set up measurements in a living room. Instead, I operate out of my cellar electronics lab. If you’re not one of those fortunate people who can dedicate most of their time to speaker design and construction (and I’m not), then you have to hunt up the loudspeaker, the cables, the power amps, the jigs, an external sound card, a stand to put the speaker on, a test microphone, and a microphone preamp. Then dig out the various speaker-specific bits, set everything up, and verify the operation each time. Oh yes, and re-familiarize yourself with the acoustic end of the measurement software. (For example: When I did this six months ago, I remember using that command, where the devil is it? or I forgot how to load the microphone calibration files, let’s read through the manual again, etc.)
This is sadly not trivial since the most versatile software is by definition bloated with rarely used features, which means lots of menus and dialog boxes to try to dig through to find what you want. On top of that, most of the preferred software options seem to originate from outside the US and England, so you have the triple-whammy of complex operation, manuals written in the turgid and opaque style of software engineers, and somewhat idiosyncratic English in the manual and in some of the menu commands. Warning: The first time performing a measurement (or the first time in a while) means a very steep learning curve looms ahead.
So the time breakdown for doing a measurement might be several hours or more, with the measurement only taking a few seconds, but a lot of preparation and debugging prior to that. Again, if you do speaker work daily, it’s only a one-time inconvenience.
This is where the CLIO Pocket comes in handy. It is for people who want to quickly and accurately take basic measurements, using a self-contained package and a minimum amount of sweat. Does it deliver on this promise? What has been sacrificed in functionality and versatility in the pursuit of convenience? How should someone choose between a CLIO Pocket and a sound card system?
The CLIO Pocket
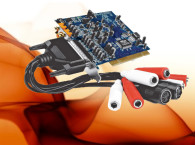
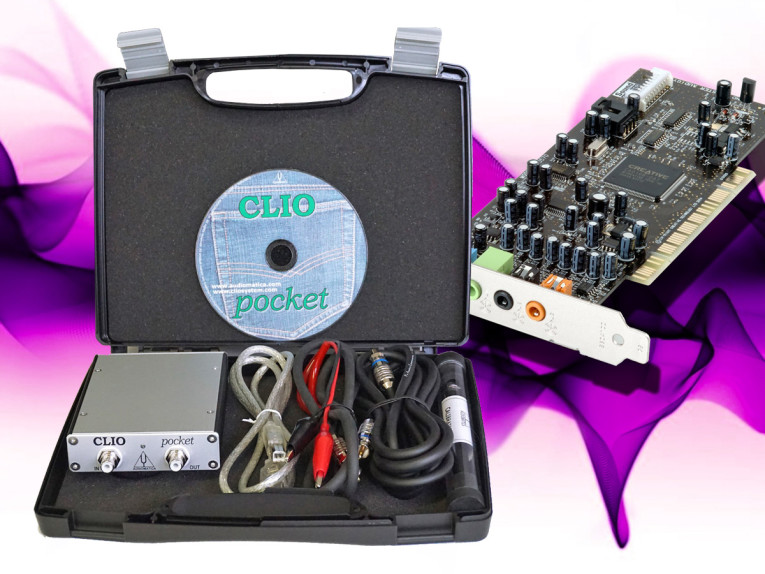
As D’Appolito explained in his review, the CLIO Pocket includes just about everything you need — a compact USB-connected module containing most of the electronics, test leads with alligator clip termination for impedance measurement, and a dedicated test microphone. You’ll still need a power amplifier for measurements other than impedance and near-field frequency response. I used a small LM1875-based chip amplifier, which has more than enough power. You’ll also need microphone stands and a way of clipping the microphone to the stand. (Audiomatica sells a kit with the appropriate microphone mounting clip and a microphone calibration adapter.)
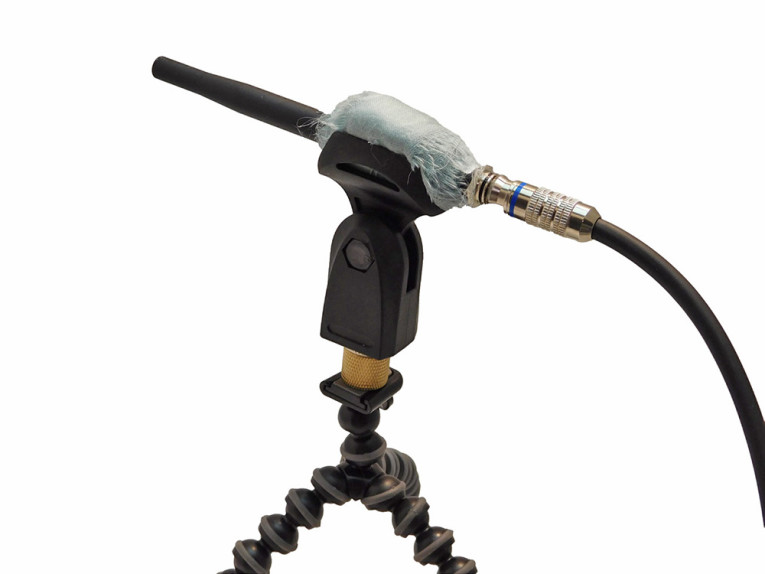
Ever the impecunious experimenter, I searched through my junk box and found that every microphone mount I had was too big for the slimline microphone provided. So with my usual fine workmanship, I ended up improvising a shock mount from a standard-sized microphone mount and a strip of cotton (see Photo 1). It might be even better than the “official” microphone mount.
For convenience, I used two different microphone stands — a standard boom stand for 1m and farfield measurements and a small flexible tripod (shown in the Photo 1) for near-field measurement.
One note: Audiomatica recommends that the CLIO Pocket unit warm up for 15 to 20 minutes before calibration. They aren’t kidding—you’ll get “Calibration failed” warnings until things are good and warm, which can be disconcerting when someone (I’m not mentioning any names) is careless about reading the directions.
The Sound Card
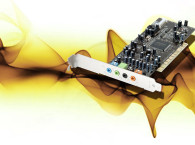
Many of the good general measurement software packages have loudspeaker measurement capability. For my comparisons, I used ARTA (the registered version) along with an inexpensive USB sound card, the Focusrite Scarlett 2i2. The 2i2 has built-in microphone preamps and a phantom power option, which reduces the number of interconnected boxes needed. Its distortion characteristics are nothing to write home about, especially at high frequencies, but it’s functional for loudspeaker work where we generally are not pushing parts-per-million distortion. The folks at ARTA feel that this particular card has inadequate dynamic range in two-channel mode, but that’s not a huge limitation for most applications. Also, the examples I’ve seen from them show frequency response errors on the order of 0.1 dB. I’m not too worried. But if you aren’t as dollar-constrained as I am, several more expensive cards will overcome this objection.
Because of the demands of the communications industry for inexpensive but high-quality compact microphones, electret microphone capsules have proliferated. Scott Wurcer demonstrated in a series of articles that with relatively simple interfaces, excellent noise performance and wide frequency response can be readily obtained (see Resources). As a result, speaker designers have a lot of good choices for inexpensive test microphones based on electret capsules.
Ideally, you would want a microphone with traceable calibration, since most software packages can accommodate calibration files to correct the measured frequency response. iSEMcon sent me a couple of excellent test microphones, and I ended up using the iSEMcon EMX7150 (which I will write more about in next month’s article), with its supplied calibration file. There are also good inexpensive choices from, among others, Behringer, Dayton Audio, and MicW. If you have the money, Earthworks, Josephson/Gefell, Brüel & Kjær Sound & Vibration Measurement, and PCB Piezotronics offer first-rate laboratory-grade measurement microphones. The iSEMcon measurement microphones sit somewhere in between.
The Cost Difference
The CLIO Pocket sells for approximately $600. To set up a sound-card-based system with similar capabilities, you’ll need a USB sound card (approximately $150), a test microphone with calibration (approximately $300), and measurement software (approximately $100). Figure another $50 for cables and the price ends up being a wash. You can put together a significantly less expensive package by substituting a different microphone (e.g., the Behringer ECM8000 for approximately $60) and freeware such as REW, but you’re on your own as far as calibration goes.
Low-level measurements are more chancy because of higher microphone noise, and even surprisingly good freeware (e.g., REW) lack the versatility of proprietary packages such as ARTA or (as we will see) the flexibility and ease of use of CLIO’s software.
My current speaker project (which I expect to publish on my website next year) is a mini-monitor, intended for use with a subwoofer. It is based on the excellent 4” woofer-midrange driver used by NHT in its venerable Super Zero design. The original NHT was a low-cost giant-killer in its day, but had a few performance issues. The most obvious one (aside from the missing bass) was integration between the tweeter and the woofer. With normal program material, the speakers sounded smooth and a little laid back, but with a bit of extra zing at the very top end.
This was quite an achievement for a design that used no crossover on the woofer, relying on the mechanical properties of the cone and the surround to provide the necessary rolloff. The tweeter crossover is a single capacitor. Clearly, this is engineered to a budget, and I say that with admiration—getting a design this simple to sound as good as it does is a lot harder than engineering with a generous budget!
The clue to the areas that need improvement can be found with pink noise excitation. To my ear, the woofer and the tweeter sound completely separate rather than the noise integrating into a unified virtual location. This usually means that there’s a frequency response hole near the crossover or a discontinuity in the polar pattern. So one of the goals in my eventual design is to make that transition as smooth as possible.
Although the woofer/midrange is a fine piece of design work, the tweeter I used was built to a price. This is also reflected in the rather diffuse quality (if I may use that term) in the treble, which contrasts with the microscopically detailed high-end of the Super Zero’s big brother, the mighty M3.3. This will be changed in the new mini-monitors.
As a candidate for replacement, I recently acquired a surplus pair of AMT tweeters marked “Legacy Folded Ribbon,” indicating the company to which they were OEMed. The origin is unknown, but they sure do look like ELAC JET tweeters. Since these tweeters came with no documentation, it seemed logical to start by characterizing them. In last month’s article, “Sound Cards for Data Acquisition in Audio Measurements (Part 6): Examples of Sound-Card-Based Measurements,” I discussed how to use a sound card and an Audio-Tester to get an impedance. This time I am using the CLIO Pocket.
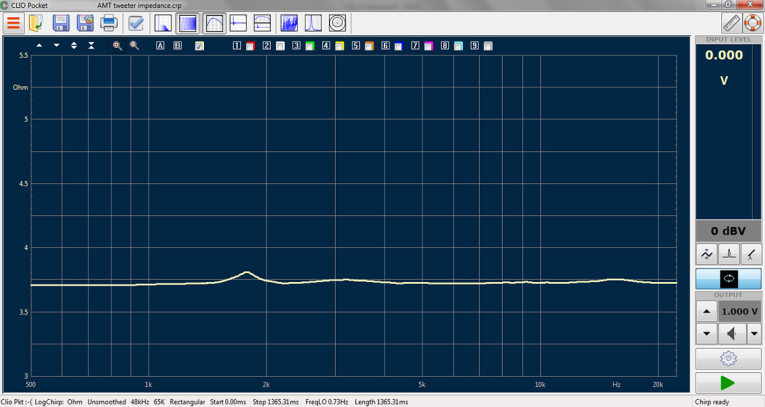
Once the unit was warmed up and calibrated (an automatic procedure only requiring a menu button press), impedance measurement setup and acquisition took less than a minute. I connected the cable with clips from the CLIO’s output to the driver terminals, selected Log Chirp from the menu bar, set the Y-axis units to ohms, and fired away.
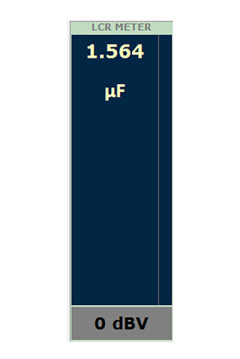
measures a component’s inductance (L),
capacitance (C), and resistance (R).
CLIO Pocket enables you to export the numerical data for magnitude and phase so that with something such as Excel, you can produce Heyser plots. It would be nice to have that capability right in the CLIO software, but I admit there aren’t many of us currently using Heyser plots (although there should be). While we are discussing impedance, a useful feature is a built-in LCR meter (see Figure 3). It’s very fast, convenient, and makes matching crossover parts a breeze.
I took frequency response measurements with the tweeter mounted on essentially an infinite baffle made from Styrofoam insulation board. This smooth, relatively dense, and inexpensive material is available in 4’ × 8’ sheets at most building supply outlets. It is easy to cut holes in, and sturdy and nonresonant enough to support all but the largest and heaviest drivers. For 1 m measurements, the external power amplifier is driven by the CLIO Pocket module. Because I’m a coward, I put a volume control at the input and turned it all the way down when starting an excitation from the CLIO’s generator function, then I slowly advanced it while watching the sound pressure level (SPL) measurement until it reached 80 dB SPL.
I measured the frequency response using the Log Chirp option, which is basically a rapidly swept sine wave (see Figure 4). The bottom graph is the calculated impulse response, with the gated region (to eliminate the influence of room reflections) highlighted. The top graph is the SPL frequency response calculated via a Fast Fourier Transform (FFT) of the gated impulse response with a half-Hanning window. Note that the rolloff at the low end is consistent with the small impedance peak at 1.8 kHz. The frequency response is reasonably flat, fitting into a ±2.5 dB window from 3 to 20 kHz.
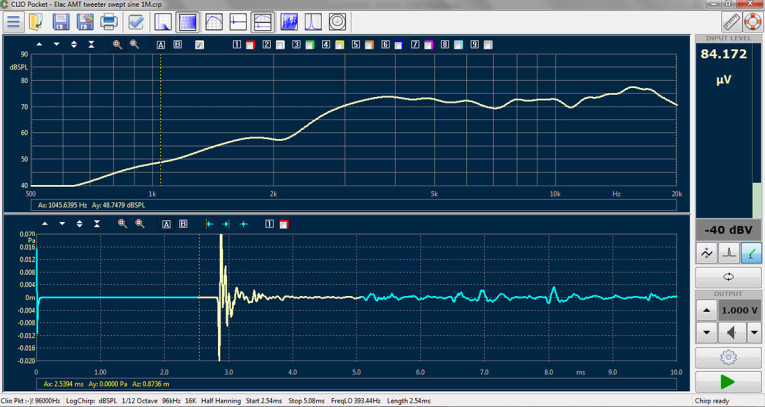
Given that there’s no correction for things such as microphone stand reflections, that’s a very satisfactory result. Even more satisfying is the easy and intuitive way in which the measurement was set up and acquired. There was no fumbling around through a thick manual and cursing when I couldn’t make the software do what I wanted through my own ignorance.
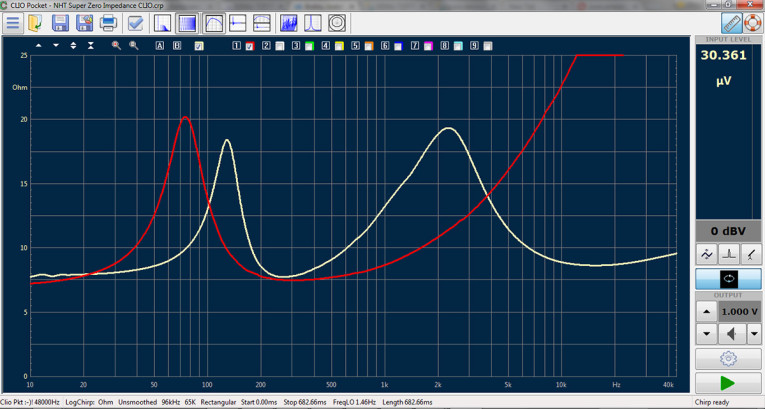
Likewise, CLIO Pocket makes it simple to acquire impedance and SPL data for the woofer/midrange. Figure 5 is a comparison of the freeair impedance curve for this driver (in red) vs. the same driver in a Super Zero (in white), which has a volume of about 2 ltr. The driver’s fundamental resonance moves from 75 Hz in free air to 128 Hz in the enclosure (the second, higher frequency peak is from the tweeter crossover). There’s a provision in the menus to calculate Thiele-Small (T-S) parameters. QTC for this volume ended up being about 1, which was perfect for integration of a subwoofer by using a second-order high-pass filter with a Q of 0.5 on this driver/box combination, combined with a fourth-order Linkwitz-Riley lowpass filter on the subwoofer. I want to emphasize that the time from setup to useful data was less than 5 minutes for these measurements.
Round Two
It’s always nice to star t a design and modification project with some baselining. So to show what the sound-card combination can do, I conducted some more complete measurements on the Super Zero to see if I could pin down the cause of the minor sonic issues before I attempted to fix them with the redesign. Since D’Appolito discussed the step-by-step method to get quasi-anechoic data using the CLIO Pocket, I thought it would be useful to do the same thing with ARTA and a sound card. Briefly, a quasi-anechoic response is obtained by taking a near-field measurement for the bass, a 1 m measurement for the midrange and treble, picking a point to merge the two responses, adjusting the displayed SPL of the responses to match, then trimming the two responses.
Before acquiring data, I loaded the microphone calibration f ile supplied with the iSEMcon EMX7150 into ARTA, using the frequency response compensation menu under Setup, a painless process. I did not go through the entire ARTA calibration procedure for SPL, so my measurements are relative. When I needed to determine specific SPL, I cheated and used one of two SPL meters that I keep on hand. Sheer laziness on my part, admittedly, but I have to admit that I missed the CLIO automated calibration here.

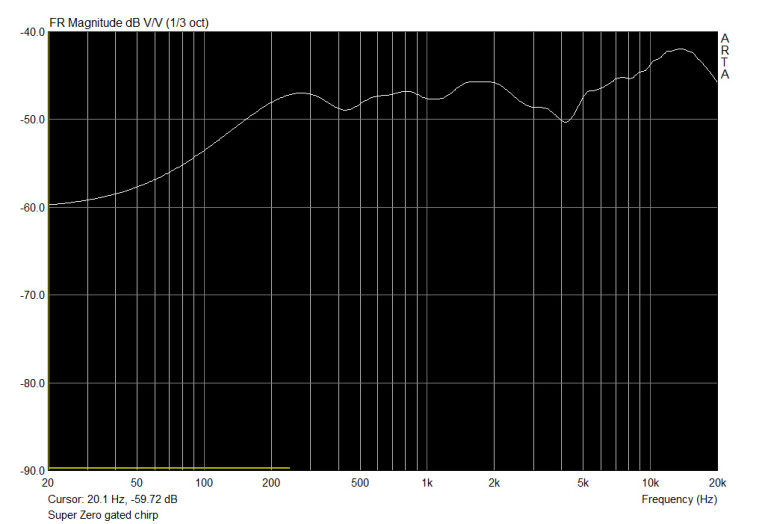
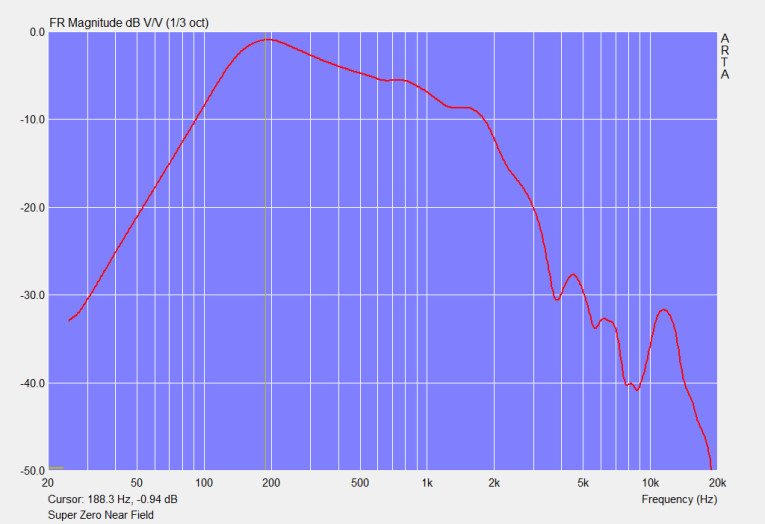
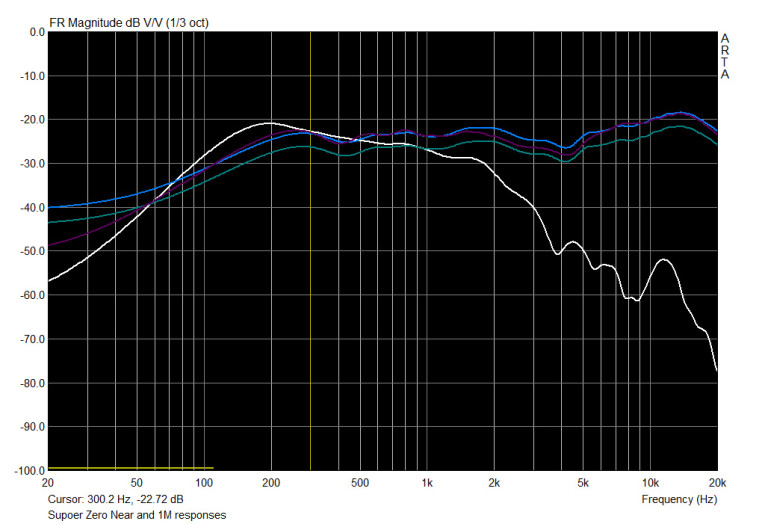
Figure 6 shows the 1 m on-axis impulse response. I chose gating to eliminate the influence of room reflections at the expense of the low frequency limit of the measurement. Figure 7 shows the transformed frequency response. Figure 8 shows the near-field measurement of the Super Zero. There is a nifty baffle compensation calculation feature, found (non-intuitively) in the Edit options. This function transforms infinite baffle or near field measurements into free space response for the actual baffle size. This useful feature is not found in the CLIO Pocket.
Next, the near-field and far-field measurements are combined using overlays (see Figure 9), then trimmed (see Figure 10) to yield the quasi-anechoic response. And it’s pretty clear where that disconnected quality in the treble originates: the broad 5 to 6 dB dip centered at 4 kHz. This is most likely a tweeter defect, since it occurs about an octave above the crossover point.
So far, we can pretty much duplicate the CLIO Pocket’s capabilities with a sound card, a test microphone, and software. But the versatility of general measurement software enables us to get quite a bit of additional information, if we’re willing to expend the effort. There’s a remarkable variety of esoteric measurements available in general software packages, but for the purpose of this article, I’ll limit myself to just a few more common functions.


One interesting feature of ARTA is the ability to calculate group delay as a function of frequency (see Figure 11). The tweeter acoustic response is seen to lag the woofer by about 0.2 ms, which is well below what we can detect by ear. And, the group delay curves are satisfyingly flat. Perhaps this is one reason for the outstanding imaging of these speakers?
Another major contributor to the imaging of speakers (as well as their in-room tonal balance) is the polar pattern or directivity. The CLIO Pocket has a tantalizing button on the menu bar for polar plots, but it is not mentioned in any of the documentation, and the button appears to be inactive (note: polar plots are available in the current software version). No worries, we can do polar plots in ARTA.
My physical setup was rather crude - a kitchen Lazy Susan and a protractor. The speaker was measured on axis, and at ±22°, ±45°, and ±90°. Because of this rather hastily assembled setup, my plots were not a model of perfect symmetry. More data points would have given me better resolution, but they still gave me the basic information I needed. Once the response data are acquired, the polar pattern can be graphed in several ways (e.g., waterfall, contour plots, or polar diagram). I chose the polar diagram, and the ARTA software enables me to select the frequencies for display.
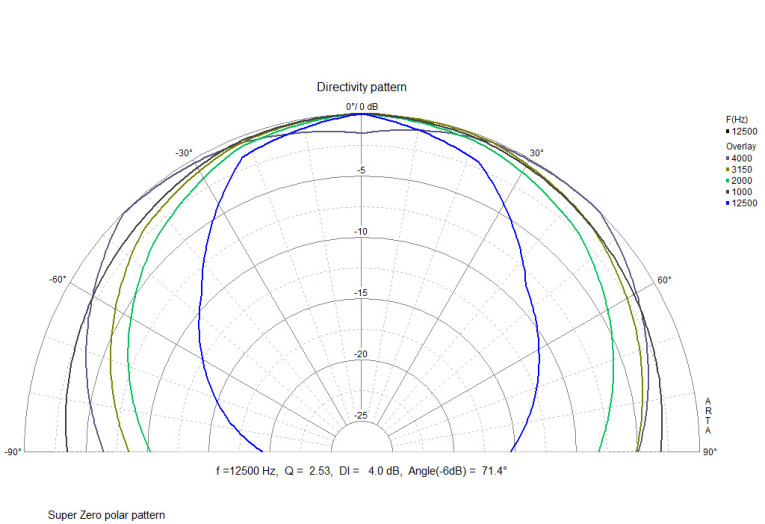
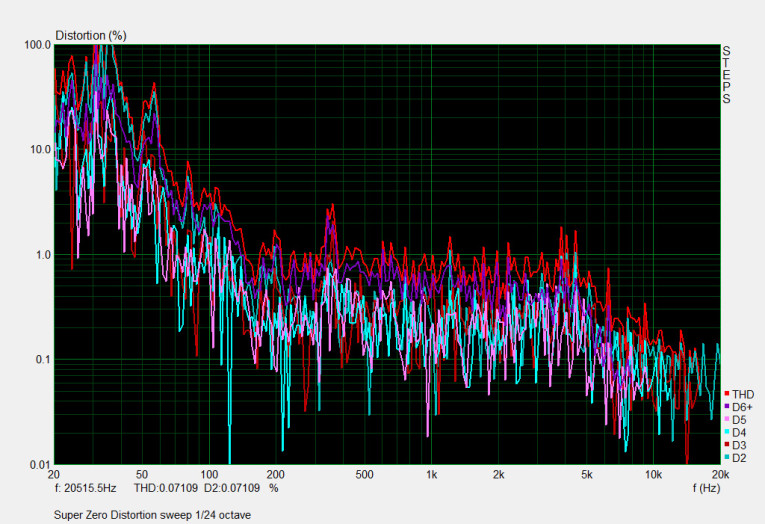
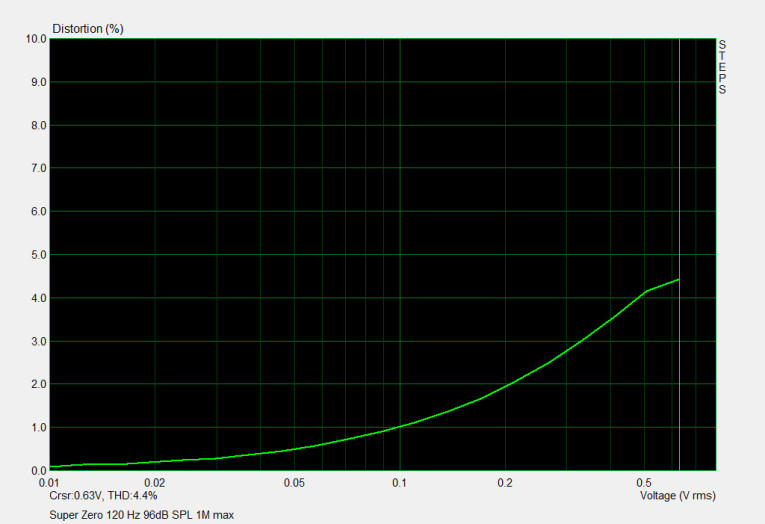
Figure 12 shows this plot and gives another clue to the “disconnected” treble. Looking at the 4 kHz contour, corresponding to the dip in on-axis response, we can see that the dip fills in off axis. This sort of directional behavior can flatten the speaker’s power response, and thus, the overall perceived tonal balance, but can potentially cause audible issues.
Another nice non-exotic feature of the sound card system using ARTA is the ability to get detailed distortion measurements. The CLIO Pocket system can measure total harmonic distortion (THD) at spot frequencies and even give a distortion spectrum, but to get a plot of distortion vs. frequency or distortion vs. level, the data must be manipulated and plotted externally (e.g., using Excel). This feature is built into the STEPS module of ARTA.
Figure 13 shows a measurement of distortion vs. frequency, harmonic by harmonic, for the Super Zero at 1 m on axis at approximately 85 dB SPL. This is done in a single measurement. As expected, the distortion is reasonably low, and rises at lower frequencies where the woofer is being driven to greater excursions.
Since my eventual speaker will likely be crossed over near 120 Hz, I thought that it might be useful to see how distortion varies with level at that frequency. STEPS can perform this measurement with a couple of mouse clicks, and the results are shown in Figure 14.
Since I hadn’t gone through the full calibration process, the numbers on the X-axis are again relative, but using an SPL meter, I determined that the highest level of the measurement was at 96 dB SPL at 1 m. The distortion there is still fairly low, especially considering the diminutive size of the Super Zero woofer. I attempted to take the measurement to a higher SPL, but the sound inevitably caused my rather sizable dog to start barking loudly, and that woofer was able to overcome the level of the Super Zero woofer, invalidating those measurements.
The Winner By Decision
The company where I work for my day job trains everyone on a set of business practices that it calls a Toolbox. The most important tool in the Toolbox — the primus inter pares (and the one that we are supposed to live and breathe) — is called 80/20. It’s a simplification of Pareto’s Law and says that for any process, 80% of results come from 20% of effort. The remaining 20% of results requires 80% of the effort.
The CLIO Pocket is a perfect example of 80/20 in action. For 20% of the effort and complication of using a versatile and sophisticated sound card system, you can get 80% of the results that you’d ever need. More importantly, that 80% includes all of the important factors needed for first-class speaker design and characterization: impedance, frequency response, both on-and-off axis, waterfall plots, crossover transfer functions, and THD. It is self-contained except for the power amplifier and is remarkably easy to set up, calibrate, and use. It is limited to a single channel, and tied to a specific test microphone for input (though another source can be used without the ability to calibrate).
For about the same amount of money, you can get an external sound card, a calibrated test microphone, and sophisticated software capable of doing everything the CLIO Pocket does, and a whole lot more (e.g., multichannel capability, and distortion sweeps). If I did speaker design and testing on a frequent basis and didn’t usually need to reconfigure things for circuit measurements, this would absolutely be the way I’d go. In exchange for a one-time steep learning curve, significant setup and calibration time and effort, the avid speaker builder can obtain a tremendous number of measurements, taking it much farther than I did. Once you’ve done something a few times and continue to practice, it quickly becomes second nature. The major difficulty for a short article was narrowing down the measurement possibilities, which I think is a pretty good problem to have.
On the other hand, for someone like me, who mostly designs and builds electronics but likes to get his hands dirty with loudspeakers on an occasional basis, the CLIO Pocket is a better option. The reduced functionality is of far less consequence than the ability to rapidly and effortlessly get the fundamental design and validation inputs with a high degree of confidence in the accuracy of the results. In the best of all worlds, I’d have both, and the cost for that isn’t terribly steep. ax
Resources
J. D’Appolito, “Audiomatica’s CLIO Pocket Electro-Acoustic Portable Measurement System,” audioXpress, October 2015.
“ARTA User Manual,” www.artalabs.hr/download/arta-user-manual.pdf.
“STEPS User Manual,” www.artalabs.hr/download/steps-user-manual.pdf.
S. Wurcer, “DIY Low Noise Microphone Preamplifiers, Part II,” Linear Audio, Volume 3, Winter 2012.
———, “Low Noise Microphone Preamps,” Linear Audio, Volume 1, Spring 2011.
S. Yaniger, “Sound Cards for Data Acquisition in Audio Measurements (Part 6): Examples of Sound-Card-Based Measurements,” audioXpress, November 2015.
 About the Author
Stuart Yaniger has been designing and building audio equipment for nearly half a century, and currently works as a technical director for a large industrial company. His professional research interests have spanned theoretical physics, electronics, chemistry, spectroscopy, aerospace, biology, and sensory science. One day, he will figure out what he would like to be when he grows up.
This article was originally published in audioXpress, December 2015
Read Part 1 | Read Part 2 | Read Part 3 | Read Part 4 | Read Part 5 | Read Part 6